
UNITED STATES
SECURITIES AND EXCHANGE COMMISSION
Washington, D.C. 20549
SCHEDULE 14A
Proxy Statement Pursuant to Section 14(a) of the
Securities Exchange Act of 1934
(Amendment No. )
Filed by the Registrant ☒ Filed by a Party other than the Registrant ☐
Check the appropriate box:
| ☐ | Preliminary Proxy Statement | |||
| ☐ | Confidential, for Use of the Commission Only (as permitted by Rule 14a-6(e)(2)) | |||
| ☒ | Definitive Proxy Statement | |||
| ☐ | Definitive Additional Materials | |||
| ☐ | Soliciting Material Pursuant to§240.14a-12 | |||
Fortune Brands Home & Security, Inc. | ||||
| (Name of Registrant as Specified In Its Charter) | ||||
| (Name of Person(s) Filing Proxy Statement, if other than the Registrant) | ||||
| Payment of Filing Fee (Check the appropriate box): | ||||
| ☒ | No fee required. | |||
| ☐ | Fee computed on table below per Exchange Act Rules 14a-6(i)(4) and 0-11. | |||
| (1) | Title of each class of securities to which transaction applies:
| |||
| ||||
| (2) | Aggregate number of securities to which transaction applies:
| |||
| ||||
| (3) | Per unit price or other underlying value of transaction computed pursuant to Exchange Act Rule 0-11 (set forth the amount on which the filing fee is calculated and state how it was determined):
| |||
| ||||
| (4) | Proposed maximum aggregate value of transaction:
| |||
| ||||
| (5) | Total fee paid: | |||
| ||||
| ☐ | Fee paid previously with preliminary materials. | |||
| ☐ | Check box if any part of the fee is offset as provided by Exchange Act Rule0-11(a)(2) and identify the filing for which the offsetting fee was paid previously. Identify the previous filing by registration statement number, or the Form or Schedule and the date of its filing. | |||
| (1) | Amount Previously Paid:
| |||
| ||||
| (2) | Form, Schedule or Registration Statement No.:
| |||
| ||||
| (3) | Filing Party:
| |||
| ||||
| (4) | Date Filed:
| |||
| ||||
520 Lake Cook Road, Deerfield, Illinois 60015
NOTICE OF ANNUAL MEETING
AND PROXY STATEMENT
March 7, 201714, 2018
Dear Fellow Stockholders:
We are pleased to invite you to the 20172018 Annual Meeting of Stockholders (“Annual Meeting”) of Fortune Brands Home & Security, Inc. on Tuesday, May 2, 20171, 2018 at 8:00 a.m. (CDT) at the Renaissance Chicago North Shore Hotel, 933 Skokie Boulevard, Northbrook, Illinois. The following matters will be considered at the Annual Meeting:
| Proposal 1: | ||
| Proposal 2: | ||
| Proposal 3: | ||
| Proposal 4: | Advisory vote to approve the frequency of voting on the compensation paid to the Company’s named executive officers (see page | |
such other business as may properly come before the Annual Meeting.
Stockholders of record at the close of business on March 3, 2017,2, 2018, the record date for the Annual Meeting, are entitled to vote.Stockholders who wish to attend the Annual Meeting in person should review the instructions beginning on page 1.
YOUR VOTE IS VERY IMPORTANT. WHETHER OR NOT YOU PLAN TO ATTEND THE ANNUAL MEETING, PLEASE SUBMIT YOUR PROXY OR VOTING INSTRUCTIONS AS SOON AS POSSIBLE. See pages1-41-5 for voting instructions.
This Proxy Statement and accompanying proxy are first being distributed on or about March 14, 2017.2018.
|
| Robert K. Biggart |
| Senior Vice President, General Counsel and Secretary |
Important Notice Regarding the Availability of Proxy Materials
for the 20172018 Annual Meeting of Stockholders to be Held on Tuesday, May 2, 2017.1, 2018.
This Notice of Annual Meeting and Proxy Statement and the Annual Report on Form10-K for the fiscal year ended December 31, 20162017 (“Form10-K”) are available atwww.proxyvote.comwww.proxyvote.com.
| 1 | ||||
Compensation Committee Interlocks | ||||
| 26 | ||||
| 33 | ||||
| 34 | ||||
| 35 | |||
| 37 | ||||
| 39 | ||||
| 40 | ||||
| 42 | ||||
| 43 | ||||
PROPOSAL 2 – RATIFICATION OF APPOINTMENT OF INDEPENDENT REGISTERED PUBLIC ACCOUNTING FIRM | ||||
PROPOSAL 3 – ADVISORY VOTE ON NAMED EXECUTIVE OFFICER COMPENSATION | ||||
PROPOSAL 4 – ADVISORY VOTE ON THE FREQUENCY OF VOTING ON NAMED EXECUTIVE OFFICER COMPENSATION | 47 | |||
| A-1 |
Why did I receive these materials?
These materials were provided to you in connection with the solicitation by the Board of Directors (the “Board”) of Fortune Brands Home & Security, Inc. (“Fortune Brands” or the “Company”), of proxies to be voted at our Annual Meeting and at any adjournment or postponement of the Annual Meeting. The Annual Meeting will take place on May 2, 20171, 2018 at 8:00 a.m.00a.m. (CDT) at the Renaissance Chicago North Shore Hotel, 933 Skokie Boulevard, Northbrook, Illinois. This Proxy Statement describes the matters on which you, as a stockholder, are entitled to vote and gives you the information that you need to make an informed decision on these matters.
Why did I receive a “Notice of Internet Availability of Proxy Materials” instead of printed proxy materials?
Companies are permitted to provide stockholders with access to proxy materials over the Internet instead of mailing a printed copy. WeUnless we were instructed otherwise, we mailed a Notice of Internet Availability of Proxy Materials (the “Notice”) to most stockholders. The Notice contains instructions on how to access the proxy materials on the Internet, how to vote and how to request a printed set of proxy materials. This approach reduces the environmental impact and our costs of printing and distributing the proxy materials, while providing a convenient method of accessing the materials and voting.
The Company will make its Annual Report on Form10-K for the last fiscal year, including any financial statements or schedules, available to stockholders without charge, upon written request to the Secretary, Fortune Brands Home & Security, Inc., 520 Lake Cook Road, Deerfield, Illinois 60015. The Company will furnish exhibits to Form10-K to each stockholder requesting them upon payment of a $.10 per page fee to cover the Company’s cost.
Can I get electronic access to the proxy materials if I received printed materials?
Yes. If you received printed proxy materials, you can also access them online atwww.proxyvote.combefore voting your shares. The Company’s proxy materials are also available on our website athttp://ir.fbhs.com/annuals-proxies.cfm. Stockholders are encouraged to elect to receive future proxy materials electronically. If you opt to receive our future proxy materials electronically, you will receive an email next year with instructions containing a link to view those proxy materials and a link to the proxy voting website. Your election to receive proxy materials by email will remain in effect until you terminate it or for as long as the email address provided by you is valid. Stockholders of record who wish to participate can enroll athttp://enroll.icsdelivery.com/fbhs. If your shares are held in an account by a bank, broker or other nominees, you should check with your bank, broker or other nominee regarding the availability of this service.
What is the difference between being a stockholder of record and a beneficial owner?
If your shares are registered directly in your name with Wells Fargo ShareownerEQ Shareholder Services, the Company’s transfer agent, you are the “stockholder of record.” If your shares are held in an account by a bank, broker or other nominee, you hold your shares in “street name” and are a “beneficial owner” of those shares. The majority of stockholders are beneficial owners. For such shares, a bank, broker or other nominee is considered the stockholder of record for purposes of voting at the Annual Meeting. Beneficial owners have the right to direct their bank, broker or other nominee on how to vote the shares held in their account by using the voting instructions provided by the bank, broker or other nominee.
Who is entitled to vote?
Only stockholders who owned the Company’s common stock of record at the close of business on March 3, 20172, 2018 (the “Record Date”) are entitled to vote. Each holder of common stock is entitled to one vote per share. There were 153,504,413148,018,012 shares of common stock outstanding on the Record Date.
FREQUENTLY ASKED QUESTIONS (CONTINUED)
Who can attend the Annual Meeting?
Only stockholders who owned Fortune Brands’ common stock as of the close of business on the Record Date, or their authorized representatives, may attend the Annual Meeting. At the entrance to the meeting, stockholders will be asked to present valid photo identification to determine if you owned common stock ownership on the Record Date. If you are acting as a proxy, you will need to submit a valid written legal proxy signed by the owner of the common stock.You must bring such evidence with you to be admitted to the Annual Meeting.
Stockholders who own their shares in “street name” will be required to submit proof of ownership at the entrance to the meeting. Either your voting instruction card or brokerage statement reflecting your stock ownership as of the Record Date may be used as proof of ownership.
What matters will be voted on at the Annual Meeting?
ThreeFour matters will be considered at the Annual Meeting, which are:
| • |
|
| • |
|
| • | advisory vote to approve the compensation paid to the Company’s named executive officers(Proposal 3); and |
| • |
|
How do I vote?
If you received a Notice in the mail, you can either vote by (i) Internet (www.proxyvote.com) or (ii) in person at the Annual Meeting. Voting instructions are provided on the Notice. You may also request to receive printed proxy materials in the mail.
Stockholders who received printed proxy materials in the mail can vote by (i) filling out the proxy card and returning it in the postage paid return envelope, (ii) telephone(800-690-6903), (iii) Internet (www.proxyvote.com), or (iv) in person at the Annual Meeting. Voting instructions are provided on the proxy card.
Stockholders who received proxy materials electronically can vote by (i) Internet (www.proxyvote.com), (ii) telephone(800-690-6903), or (iii) in person at the Annual Meeting.
If you are not the stockholder of record, but are a beneficial owner of our shares, you must vote by giving instructions to your bank, broker or other nominee. You should follow the voting instructions on the form that you receive from your bank, broker or other nominee, which will include details on available voting methods.To be able to vote in person at the Annual Meeting, you must obtain a legal proxy from your bank, broker or other nominee in advance and present it to the Inspector of Election with your completed ballot at the Annual Meeting.
How will my proxy be voted?
Your proxy card, when properly signed and returned to us, or processed by telephone or via the Internet, and not revoked, will be voted in accordance with your instructions. If any matter is properly presented other than the threefour proposals described above, the Proxy Committee (the persons named in the enclosed proxy card or, if applicable, their substitutes),substitutes, will have discretion to vote your shares in their best judgment.
FREQUENTLY ASKED QUESTIONS (CONTINUED)
What if I don’t mark the boxes on my proxy or voting instruction card?
Unless you give other instructions on your proxy card or your voting instruction card, or unless you give other instructions when you cast your vote by telephone or the Internet, the Proxy Committeepersons named in the enclosed proxy card will vote your shares in accordance with the recommendations of the Board, which areFORthe election of each director named in Proposal 1,FORProposals 1, 2 and 3.
3 andFREQUENTLY ASKED QUESTIONS (CONTINUED)ONE YEAR for the frequency of the advisory vote to approve the compensation of the Company’s named executive officers (Proposal 4).
If you hold shares beneficially and you have not provided voting instructions, your bank, broker or other nominee is only permitted to use its discretion and vote your shares on certain routine matters (Proposal 2). If you have not provided voting instructions to your bank, broker or other nominee onnon-routine matters (Proposals 1, 3 and 3)4), your bank, broker or other nominee is not permitted to use discretion and vote your shares.Therefore, we urge you to give voting instructions to your bank, broker or other nominee on all threefour proposals.Shares that are not permitted to be voted by your bank, broker or other nominee with respect to any matter are called “brokernon-votes.” Brokernon-votes are not considered votes for or against a proposal and will have no direct impact.impact on the voting results, but will be counted for the purposes of establishing a quorum at the Annual Meeting.
How many votes are needed to approve a proposal?
The nominees for director, innon-contested elections, must receive a majority of the votes cast at the Annual Meeting, in person or by proxy, to be elected. A proxy card marked to abstain on the election of a director and any brokernon-votes will not be counted as a vote cast with respect to that director.
Under the Company’s majority vote Bylaw provision relating to the election of directors, if the number of votes cast “for” a director nominee does not exceed the number of votes cast “against” the director nominee, then the director must tender his or her resignation from the Board promptly after the certification of the stockholder vote. The Board (excluding the nominee in question) will decide within 90 days of that certification, through a process managed by the Nominating and Corporate Governance Committee, whether to accept the resignation. The Board’s explanation of its decision will be promptly disclosed in a filing with the Securities and Exchange Commission (“SEC”).
The affirmative vote of shares representing a majority in voting power of the common stock, present in person or represented by proxy at the Annual Meeting, and entitled to vote is necessary for the approval of Proposals 2 and 3.
For Proposal 4, stockholders may vote in favor of holding the vote to approve the compensation paid to the Company’s named executive officers every one year, every two years or every three years and they may also choose to abstain. The option of every one year, every two years or every three years that receives the highest number of votes cast by stockholders will be considered by the Board as the stockholders’ recommendation as to the frequency of future advisory votes on executive compensation.
Proxy cards marked to abstain on Proposals 2 and 3 will have the effect of a negative vote. Proxy cards marked to abstain on Proposal 4 will have no effect on the outcome. Brokernon-votes are not applicable to Proposal 2 because your bank, broker or other nominee will be permitted to use discretion to vote your shares on this proposal. Brokernon-votes will have no impact on Proposals 1, 3 and 3.4.
How can I revoke my proxy or change my vote?
You may revoke your proxy by giving written notice to the Secretary of the Company or by delivering a later dated proxy at any time before it is actually voted. If you voted on the Internet or by telephone, you may change your vote by voting again. Your last vote is the vote that will be counted. Attendance at the Annual Meeting does not revoke your proxy unless you vote at the Annual Meeting.
FREQUENTLY ASKED QUESTIONS (CONTINUED)
Will my vote be public?
As a matter of policy, proxies, ballots and tabulations that identify individual stockholders are not publicly disclosed, but are available to the independent Inspector of Election the proxy solicitation firm and certain employees of the Company.
What constitutes a quorum?
The presence at the Annual Meeting, in person or by proxy, of the holders of a majority in voting power of the issued and outstanding shares of common stock entitled to vote will constitute a quorum. Proxies received but marked as abstentions or without any voting instructions will be included in the calculation of the number of shares considered to be present at the Annual Meeting.
Our Board is soliciting this proxy. The Company will bear the expense of soliciting proxies for this Annual Meeting, including mailing costs. To assureensure that there is sufficient representation at the Annual Meeting, our proxy solicitor or our employees may solicit proxies by telephone, facsimile or in person. We have retained Innisfree M&A Incorporated as our proxy solicitor for a fee, estimated at $15,000, plus reasonableout-of-pocket expenses, to aid in soliciting proxies. Our total expenses will depend upon the volume of shares represented by the proxies received in response to the Notice and Proxy Statement.
FREQUENTLY ASKED QUESTIONS (CONTINUED)
What if I am a participant in the Fortune Brands Home & Security Retirement Savings Plan or the Fortune Brands Home & Security Hourly Employee Retirement Savings Plan?
We are mailing a printed copy ofParticipants who invest in the proxy materials to participants inFortune Brands Stock Fund through the Fortune Brands Home & Security Retirement Savings Plan and the Fortune Brands Home & Security Hourly Employee Retirement Savings Plan (collectively, the “Savings Plans”) who invest in the Fortune Brands Stock Fund through the Savings Plans.were mailed a Notice. The Trustee of the Savings Plans, as record holder of the Fortune Brands common stock held in the Savings Plans, will vote whole shares attributable to your interest in the Fortune Brands Stock Fund in accordance with your directions. If you investFollow the voting instructions provided in the Fortune Brands Stock Fund under the Savings Plans and you sign and return the enclosed proxy card, we will forward itNotice to the Trustee of the Savings Plans. The proxy card will serve as instruction toallow the Trustee to vote the whole shares attributable to your interest in the manner you indicate on the card.accordance with your instructions. If the Trustee does not receive timely directionvoting instructions with respect to the voting of your shares held in the Fortune Brands Stock Fund, the Trustee will vote such shares in the same manner and in the same proportion as the shares for which the Trustee receiveddid receive voting instructions.
How can I eliminate multiple mailings to the same address?
If you and other residents at your mailing address are registered stockholders and you receive more than one copy of the Notice, but you wish to eliminate the duplicate mailings, you must submit a written request to the Company’s transfer agent, Wells Fargo.EQ Shareowner Services. To request the elimination of duplicate copies, please write to Wells FargoEQ Shareowner Services, 1110 Centre Pointe Curve, Suite 101, MACN9173-010,Mendota Heights, Minnesota 55120.
If you and other residents at your mailing address own shares in street name, your broker, bank or other nominee may have sent you a notice that your household will receive only one Notice or one set of proxy materials for each company in which you hold stock through that broker, bank or other nominee. This practice, known as “householding,” is designed to reduce our printing and postage costs. If you did not respond, the bank, broker or other nominee will assume that you have consented, and will send only one copy of the Notice to your address. You may revoke your consent to householding at any time by sending your name, the name of your brokerage firm, and your account number to Broadridge, Householding Department, 51 Mercedes Way, Edgewood, New York 11717. The revocation of your consent to householding will be effective 30 days following its receipt. In any event, if you did not receive an individual copy of the Notice or proxy materials, or if you wish to receive individual copies of the Notice or our proxy materialssuch documents for future meetings, we will send aan individual copy to you if you call Shareholder Services at (847)484-4538, or write to the Secretary of Fortune Brands Home & Security, Inc., 520 Lake Cook Road, Deerfield, Illinois 60015.
FREQUENTLY ASKED QUESTIONS (CONTINUED)
How can I submit a stockholder proposal or nomination next year?
Our Bylaws provide that in order for a stockholder to (i) nominate a candidate for election to our Board at the 20182019 Annual Meeting of Stockholders, or (ii) propose business for consideration at the 20182019 Annual Meeting of Stockholders, written notice containing the information required by the Bylaws must be delivered to the Secretary of the Company no less than 90 days nor more than 120 days before the anniversary of the prior year’s Annual Meeting, that is, after January 2, 20181, 2019 but no later than February 1, 2018January 31, 2019 for the 20182019 Annual Meeting.
Under SEC rules, if a stockholder wishes to submit a proposal for possible inclusion in the Company’s 20182019 proxy statement pursuant to Rule14a-8 of the Securities Exchange Act of 1934, as amended (“Exchange Act”), we must receive it on or before November 14, 2017.2018.
The person presiding at the Annual Meeting is authorized to determine if a proposed matter is properly brought before the Annual Meeting or if a nomination is properly made.
Copies of our Restated Certificate of Incorporation and Bylaws are available upon written request to the Secretary, Fortune Brands Home & Security, Inc., 520 Lake Cook Road, Deerfield, Illinois 60015.
Summary of Qualification of Directors
The Board believes that all directors must possess a considerable amount of education and business management experience (such as experience as a chief executive, chief operating, chief financial officer or other relevant experience).experience. The Board also believes that it is necessary for each of the Company’s directors to possess many qualities and skills. The Board believes that there are certain general requirements which are mandatory for service on the Company’s Board,qualities, while there are other skills and experiences that should be represented on the Board as a whole, but not necessarily by each individual director.
General requirementsqualities for all directors:
Extensive executive leadership experience
Excellent business judgment
High level of integrity and ethics
Original thinking
Strong commitment to the Company’s goal of maximizing stockholder value
Specific experiences, qualifications, and backgrounds to be represented on the Board as a whole:
Financial and/or accounting expertise
Consumer products expertise
Knowledge of international markets
Chief executive officer/chief operating officer/chief financial officer experience
Extensive board experience
Diversity of skill, background and viewpoint
The process used by the Nominating and Corporate Governance Committee in recommending qualified director candidates is described below under Corporate Governance – Director Nomination Process (see page 106 of this Proxy Statement).
Election of Class IIII Directors
The Board consists of eight members and is divided into three classes, each having three year terms that expire in successive years. The term of the Class IIII directors expires at the 20172018 Annual Meeting of Stockholders. The Board has nominated Ms. Ann F. Hackett, Mr. A. D. David Mackay, Mr. David M. ThomasJohn G. Morikis and Mr. Norman H. Wesley,Ronald V. Waters, III, each of whom is currently serving as a Class IIII director, forre-election for a new term of three years expiring at the 20202021 Annual Meeting of Stockholders and until their successors are duly elected and qualified. ProxiesShares cannot be voted for more than the number of nominees proposed forre-election.
Each of the nominees has consented to be named as a nominee and to serve as a director, if elected. If any of them should become unavailable to serve as a director (which is not now expected), the Board may designate a substitute nominee. In that case, the Proxy Committeepersons named in the enclosed proxy card will vote for the substitute nominee designated by the Board.
The names of the nominees and the current Class III and Class IIIII directors, along with their present positions, their principal occupations and employment during the last five years, any directorships held with other public corporationscompanies during the past five years, their ages and the year first elected as a director of the Company, are set forth below. Individual qualifications and experiences of our directors that contribute to the Board’s effectiveness as a whole are also described in the following paragraphs.
PROPOSAL 1 –ELECTIONOF DIRECTORS (CONTINUED)
Name | Present positions and offices with the Company, principal occupations during the past five years and other directorships | Age | Year first elected director | |||||||
| NOMINEES FOR DIRECTOR – CLASS III DIRECTORS – TERM EXPIRING 2020 | ||||||||||
A.D. David Mackay | Retired since January 2011; President and Chief Executive Officer of Kellogg Company, a packaged foods manufacturer, prior thereto. Currently also a director of The Clorox Company. Formerly a director of Keurig Green Mountain, Inc., McGrath Limited, Woolworths Limited, Beam Inc. and Kellogg Company. | 61 | 2011 | |||||||
| Mr. Mackay held various key executive positions with Kellogg Company including Chief Executive Officer and Chief Operating Officer, bringing to our Board the perspective of a leader who faced a similar set of external economic, social and governance issues to those that face our Company. Mr. Mackay also has significant international business experience, as well as extensive board experience. | ||||||||||
David M. Thomas | Retired since March 2006; Chairman of the Board and Chief Executive Officer of IMS Health Incorporated, a provider of information services to the pharmaceutical and healthcare industries, prior thereto. Currently also a director of The Interpublic Group of Companies, Inc. and a member of the Fidelity Investments Board of Trustees. | 67 | 2011 | |||||||
| Mr. Thomas’ experience as a Chief Executive Officer of IMS Health Incorporated and his management experience at premier global technology companies, including as Senior Vice President and Group Executive of IBM, helps the Board address the challenges the Company faces due to rapid changes in IT capabilities and communications and global distribution strategies. Mr. Thomas also has extensive board experience. | ||||||||||
Norman H. Wesley | Retired since October 2008; Chairman of the Board and Chief Executive Officer of Fortune Brands, Inc. prior thereto. Currently also a director of Acuity Brands, Inc. and Achusnet Holdings Corp. Formerly a director of Keurig Green Mountain, Inc. and ACCO Brands, Inc. | 67 | 2011 | |||||||
| Mr. Wesley’s experience as Chief Executive Officer of a consumer products conglomerate gives him unique insights into the Company’s challenges, opportunities and operations. Mr. Wesley also has extensive board experience. | ||||||||||
Name | Present positions and offices with the Company, principal | Age | Year first elected director | |||||||
NOMINEES FOR DIRECTOR – CLASS I DIRECTORS – TERM EXPIRING 2021 |
| |||||||||
Ann F. Hackett | Partner andco-founder of Personal Pathways, LLC, a company providingweb-based enterprise collaboration platforms, since 2015. Prior to that, President of Horizon Consulting Group, LLC, a strategic and human resource consulting firm founded by Ms. Hackett in 1996. Currently also a director of Capital One Financial Corporation. Formerly a director of Beam Inc. | 64 | 2011 | |||||||
Ms. Hackett has extensive experience in leading companies that provide strategic, organizational and human resource consulting services to boards of directors and senior management teams. She has experience leading change initiatives, risk management, talent management and succession planning and in creating performance- based compensation programs, as well as significant international experience and technology experience. Ms. Hackett also has extensive board experience and currently serves as the lead independent director of Capital One Financial Corporation. |
| |||||||||
John G. Morikis | President and Chief Executive Officer since January 2016 and Chairman since January 2017 of The Sherwin-Williams Company, a manufacturer of paint and coatings products. President and Chief Operating Officer from 2006 to January 2016. Currently a director of The Sherwin-Williams Company. | 54 | 2011 | |||||||
| Mr. Morikis’ experience as a Chief Executive Officer and as a Chief Operating Officer of The Sherwin-Williams Company, and his more than 30 years of experience with a consumer home products company, brings to our Board the perspective of a leader who faces similar external economic issues that face our Company. | ||||||||||
Ronald V. Waters, III | Retired since May 2010; President and Chief Executive Officer of LoJack Corporation, a provider of tracking and recovery systems, from January 2009 to May 2010. Currently also a director of HNI Corporation and Paylocity Holding Corporation. Formerly a director of Chiquita Brands International, Inc. | 65 | 2011 | |||||||
| Mr. Waters has considerable executive leadership and financial management experience. He served as Chief Executive Officer and Chief Operating Officer at LoJack Corporation, a premier technology company, and as Chief Operating Officer and Chief Financial Officer at Wm. Wrigley Jr. Company, a leading confectionary manufacturing company. Mr. Waters also has extensive board experience. | ||||||||||
The Board of Directors recommends that you vote FOR the election of each nominee named above.
PROPOSAL ROPOSAL 1 –ELECTIONOF DIRECTORS (CONTINUED)
Name | Present positions and offices with the Company, principal occupations during the past five years and other directorships | Age | Year first elected director | |||||||
| CLASS I DIRECTORS – TERM EXPIRING 2018 | ||||||||||
Ann F. Hackett | Partner andco-founder of Personal Pathways, LLC, a company providingweb-based enterprise collaboration platforms, since 2015. Prior to that, President of Horizon Consulting Group, LLC, a strategic and human resource consulting firm, founded by Ms. Hackett in 1996. Currently also a director of Capital One Financial Corporation. Formerly a director of Beam Inc. | 63 | 2011 | |||||||
| Ms. Hackett has extensive experience in leading companies that provide strategic, organizational and human resource consulting services to boards of directors and senior management teams. She has experience leading change initiatives, risk management, talent management and succession planning and in creating performance-based compensation programs, as well as significant international experience and technology experience. Ms. Hackett also has extensive board experience and currently serves as the lead independent director of Capital One Financial Corporation. | ||||||||||
John G. Morikis | President and Chief Executive Officer of The Sherwin-Williams Company, a manufacturer of paint and coating products, since January 2016 and also Chairman of the Board since January 2017; President and Chief Operating Officer from 2006 to January 2016. Currently a director of The Sherwin-Williams Company. | 53 | 2011 | |||||||
| Mr. Morikis’ experience as a Chief Executive Officer and as a Chief Operating Officer of The Sherwin-Williams Company, and his more than 30 years of experience with a consumer home products company, brings to our Board the perspective of a leader who faces similar external economic issues that face our Company. | ||||||||||
Ronald V. Waters, III | Retired since May 2010; President and Chief Executive Officer of LoJack Corporation, a provider of tracking and recovery systems, from January 2009 to May 2010. Currently also a director of HNI Corporation and Paylocity Holding Corporation. Formerly a director of Chiquita Brands International, Inc. | 64 | 2011 | |||||||
| Mr. Waters has considerable executive leadership and financial management experience. He served as Chief Executive Officer and Chief Operating Officer at LoJack Corporation, a premier technology company, and as Chief Operating Officer and Chief Financial Officer at Wm. Wrigley Jr. Company, a leading confectionary manufacturing company. Mr. Waters also has extensive board experience. | ||||||||||
Name | Present positions and offices with the Company, principal | Age | Year first elected director | |||||||
CLASS II DIRECTORS – TERM EXPIRING 2019 |
| |||||||||
Susan S. Kilsby | Retired since May 2014; Senior Advisor at Credit Suisse AG, an investment banking firm, from 2009 to May 2014; Managing Director of European Mergers and Acquisitions of Credit Suisse prior thereto. Currently also a director of Shire Plc, BBA Aviation PLC and Goldman Sachs International.Formerly a director of Keurig Green Mountain, Inc., and Coca-Cola HBC AG. | 59 | 2015 | |||||||
| Ms. Kilsby has a distinguished global career in investment banking and brings extensive mergers and acquisitions and international business experience to the Board. In addition to her experience at Credit Suisse, she held a variety of senior positions with The First Boston Corporation, Bankers Trust and Barclays de Zoete Wedd. Ms. Kilsby also has extensive board experience and currently serves as thenon-executive Chair of Shire Plc. | ||||||||||
Christopher J. Klein | Chief Executive Officer of the Company since January 2010. President and Chief Operating Officer prior thereto. Currently also a director of Thor Industries, Inc. | 54 | 2010 | |||||||
| Mr. Klein’s leadership as Chief Executive Officer of the Company and his significant corporate strategy, business development and operational experience provide him with intimate knowledge of our operations and the challenges faced by the Company. Mr. Klein led the Company through thespin-off from Fortune Brands, Inc. in 2011. Prior to the Company’sspin-off, he held several leadership positions at Fortune Brands, Inc., helping to reshape the business through acquisitions and divestitures. Prior to joining Fortune Brands, Mr. Klein held key strategy and operating positions at Bank One Corporation and also served as a partner at McKinsey & Company, a global management consulting firm. | ||||||||||
PROPOSAL 1 –ELECTIONOF DIRECTORS (CONTINUED)
Name | Present positions and offices with the Company, principal occupations during the past five years and other directorships | Age | Year first elected director | |||||||
| CLASS II DIRECTORS – TERM EXPIRING 2019 | ||||||||||
Susan S. Kilsby | Retired since May 2014; Senior Advisor at Credit Suisse AG, an investment banking firm, from 2009 to May 2014; Managing Director of European Mergers and Acquisitions of Credit Suisse prior thereto. Currently also a director of Shire Plc, BBA Aviation PLC and Goldman Sachs International. Formerly a director of Keurig Green Mountain, Inc., L’Occitane International S.A. and Coca-Cola HBC AG. | 58 | 2015 | |||||||
| Ms. Kilsby has a distinguished global career in investment banking and brings extensive mergers and acquisitions and international business experience to the Board. In addition to her experience at Credit Suisse, she held a variety of senior positions with The First Boston Corporation, Bankers Trust and Barclays de Zoete Wedd. Ms. Kilsby also has extensive board experience and currently serves as thenon-executive Chair of Shire Plc. | ||||||||||
Christopher J. Klein | Chief Executive Officer of the Company since January 2010. President and Chief Operating Officer prior thereto. | 53 | 2010 | |||||||
| Mr. Klein’s leadership as Chief Executive Officer of the Company and his vast corporate strategy, business development and operational experience provide him with intimate knowledge of our operations and the challenges faced by the Company. Mr. Klein led the Company through thespin-off from Fortune Brands, Inc. in 2011. Prior to the Company’sspin-off, he held several leadership positions at Fortune Brands, Inc., helping to reshape the business through acquisitions and divestitures. Prior to joining Fortune Brands, Mr. Klein held key strategy and operating positions at Bank One Corporation and also served as a partner at McKinsey & Company, a global management consulting firm. | ||||||||||
Name | Present positions and offices with the Company, principal | Age | Year first elected director | |||||||
| ||||||||||
A.D. David Mackay | Retired since January 2011; President and Chief Executive Officer of Kellogg Company, a packaged foods manufacturer, prior thereto. Currently also a director of The Clorox Company. Formerly a director of Keurig Green Mountain, Inc., McGrath Limited, Woolworths Limited and Beam Inc. | 62 | 2011 | |||||||
| Mr. Mackay held various key executive positions with Kellogg Company including Chief Executive Officer and Chief Operating Officer, bringing to our Board the perspective of a leader who faced a similar set of external economic, social and governance issues to those that face our Company. Mr. Mackay also has significant international business experience, as well as extensive board experience. | ||||||||||
David M. Thomas | Retired since March 2006; Chairman of the Board and Chief Executive Officer of IMS Health Incorporated, a provider of information services to the pharmaceutical and healthcare industries, prior thereto. Currently also a director of The Interpublic Group of Companies, Inc. and a member of the Fidelity Investments Board of Trustees. | 68 | 2011 | |||||||
| Mr. Thomas’ experience as a Chief Executive Officer of IMS Health Incorporated and his management experience at premier global technology companies, including as Senior Vice President and Group Executive of IBM, helps the Board address the challenges the Company faces due to rapid changes in IT capabilities and communications and global distribution strategies. Mr. Thomas also has extensive board experience. | ||||||||||
Norman H. Wesley | Retired since October 2008; Chairman of the Board and Chief Executive Officer of Fortune Brands, Inc. prior thereto. Currently also a director of Acuity Brands, Inc. and Acushnet Holdings Corp. Formerly a director of Keurig Green Mountain, Inc. and ACCO Brands Corporation. | 68 | 2011 | |||||||
| Mr. Wesley’s experience as Chief Executive Officer of a consumer products conglomerate gives him unique insights into the Company’s challenges, opportunities and operations. Mr. Wesley also has extensive board experience. | ||||||||||
Fortune Brands is committed to maintaining strong corporate governance practices that are good for our stockholders and our business. We are dedicated to maintaining these practices and upholding high standards of conduct.
Corporate Governance Principles
The Board adopted a set of Corporate Governance Principles which describe our corporate governance practices and address corporate governance issues such as Board composition and responsibilities, Board meeting procedures, the establishment of Board committees, management succession planning process and review of risks. The Corporate Governance Principles are available athttp://ir.fbhs.com/corporate-governance.cfmcorporate-governance.cfm.
The Company’s Corporate Governance Principles provide that a majority of the members of the Board shall be independent directors. New York Stock Exchange requirements, as well as the Company’s committee charters, require that each member of the Audit, Compensation and Nominating and Corporate Governance Committees to be independent. The Board applies the definition of independence found in the New York Stock Exchange Listed Company Manual in determining which directors are independent. When determining each director’s independence, the Board also considered charitable contributions made by the Company to organizations with which each director is affiliated.
Applying that definition, Messrs. Mackay, Morikis, Thomas, Wesley and Waters and Mses.
Hackett and Kilsby were affirmatively determined by the Board to be independent. Due to Mr. Klein’s employment with the Company, he is not considered independent.
None of thenon-employee directors has any material relationship with the Company other than being a director and stockholder. Also, none of thenon-employee directors have participated in any transaction or arrangement that interferes with such director’s independence.
Policies with Respect to Transactions with Related Persons
The Board has adopted a Code of Business Conduct & Ethics which sets forth various policies and procedures intended to promote the ethical behavior of all of the Company’s employees, officers and directors (the “Code of Conduct”). The Code of Conduct describes the Company’s policy on conflicts of interest. The Board has established a Compliance Committee (comprised of management) which is responsible for administering and monitoring compliance with the Code of Conduct. The Compliance Committee periodically reports on the Company’s compliance efforts to the Audit Committee and to the Board.
The Board has also established a Conflicts of Interest Committee (comprised of management) which is responsible for administering, interpreting and applying the Company’s Conflicts of Interest Policy, which describes the types of relationships that may constitute a conflict of interest with the Company. Under the Conflicts of Interest Policy, directors and executive officers are responsible for reporting any potential related person transaction (as defined in Item 404 of RegulationS-K) to the Conflicts of Interest Committee in advance of commencing a potential transaction. The Conflicts of Interest Committee will present to the Audit Committee any potential related party transaction. The Audit Committee will evaluate the transaction, determine whether the interest of the related person is material and approve or ratify, as the case may be, the transaction. In addition, the Company’s executive officers and directors annually complete a questionnaire on which they are required to disclose any related person transactions and potential conflicts of interest. The General Counsel reviews the responses to the questionnaires and, if a related person transaction is reported by a director or executive officer, submits the transaction for review by the Audit Committee. The Conflicts of Interest Committee also reviews potential conflicts of interest and reports findings involving any director of the Company to the Nominating and Corporate Governance Committee (the “Nominating Committee”). The Nominating Committee will review any potential conflict of interest involving a member of the Board to determine whether such potential conflict would affect that director’s independence.
CORPORATE GOVERNANCE (CONTINUED)
Certain Relationships and Related Transactions
Since January 1, 2016,2017, the Company did not participate in any transactions in which any of its directors, executive officers, any immediate family member of a director or executive officer or any beneficial owner of more than 5% of the Company’s common stock had a direct or indirect material interest.
The Nominating Committee is responsible for, among other things, screening potential director candidates, recommending qualified candidates to the Board for nomination and assessing director independence.
When identifying director candidates, the Nominating Committee determines whether there are any evolving needs that require an expert in a particular field or other specific skills or experiences. When evaluating director candidates, the Nominating Committee first considers a candidate’s management experience and then considers issues of judgment, background, stature, conflicts of interest, integrity, ethics and commitment to the goal of maximizing stockholder value. The Nominating Committee also focuses on issues of diversity, such as diversity of gender, race and national origin, education, professional experience and differences in viewpoints and skills. The Nominating Committee does not have a formal policy with respect to diversity; however, the Board and the Nominating Committee believe that it is essential that the Board members represent diverse viewpoints. In considering candidates for the Board, the Nominating Committee considers the entirety of each candidate’s credentials in the context of these standards. With respect to the nomination of continuing directors forre-election, the individual’s contributions to the Board are also considered. For the purpose of this Annual Meeting, the Nominating Committee recommended the nomination of Ms. Hackett and Messrs. Mackay, ThomasMorikis and WesleyWaters as Class IIII directors.
In connection with future director elections, or at any time there is a vacancy on the Board, the Nominating Committee may retain a third-party search firm to assist in locating qualified candidates that meet the needs of the Board at that time.
It is the Nominating Committee’s policy to consider director candidates recommended by stockholders, if such recommendations are properly submitted to the Company. Stockholders that wish to recommend an individual as a director candidate for consideration by the Nominating Committee can do so by writing to the Secretary of Fortune Brands Home & Security, Inc. at 520 Lake Cook Road, Deerfield, Illinois 60015.
Recommendations must include the proposed nominee’s name, biographical data and qualifications, as well as other information that would be required if the stockholder were actually nominating the recommended candidate pursuant to the procedures for such nominations provided in our Bylaws. The Nominating Committee will consider the candidate and the candidate’s qualifications in the same manner in which it evaluates nominees identified by the Nominating Committee. The Nominating Committee may contact the stockholder making the nomination to discuss the qualifications of the candidate and the stockholder’s reasons for making the nomination. Members of the Nominating Committee may then interview the candidate if the committee deems the candidate to be appropriate. The Nominating Committee may use the services of a third-party search firm to provide additional information about the candidate prior to making a recommendation to the Board.
The Nominating Committee’s nomination process is designed to ensure that the Nominating Committee fulfills its responsibility to recommend candidates that are properly qualified to serve the Company for the benefit of all of its stockholders, consistent with the standards established under the Company’s Corporate Governance Principles.
The Board and management encourage communication from the Company’s stockholders. Stockholders who wish to communicate with the Company’s management should direct their communication to the Chief Executive Officer or the Secretary of Fortune Brands Home & Security, Inc. at 520 Lake Cook Road, Deerfield, Illinois 60015. Stockholders, or other interested parties, who wish to communicate with thenon-management
CORPORATE GOVERNANCE (CONTINUED)
Illinois 60015. Stockholders, or other interested parties, who wish to communicate with thenon-managementdirectors or any individual director should direct their communication c/o the Secretary at the address above. The Secretary will forward communications intended for the Board to the Chairman of the Board, or, if intended for an individual director, to that director. If multiple communications are received on a similar topic, the Secretary may, in his or her discretion, forward only representative correspondence. Any communications that are abusive, in bad taste or present safety or security concerns may be handled differently.
Mr. Thomas serves as the Company’snon-executive, independent Chairman. The Board determined that having an independent director serve as Chairman of the Board is in the best interests of our stockholders at this time. This leadership structure aids the Board’s oversight of management and allows our Chief Executive Officer to focus primarily on his management responsibilities. Thenon-executive Chairman has the responsibility of presiding at all meetings of the Board, consulting with the Chief Executive Officer on Board meeting agendas, acting as a liaison between management and thenon-management directors, including maintaining frequent contact with the Chief Executive Officer and advising him or her on the efficiency of the Board meetings, facilitating teamwork and communication between thenon-management directors and management, as well as additional responsibilities that are more fully described in the Company’s Corporate Governance Principles. In addition, the Company’snon-executive Chairman facilitates the Board’s annual performance assessment of the Chief Executive Officer.
The Board does not believe that a single leadership structure is right at all times, so the Board periodically reviews its leadership structure to determine, based on the circumstances at the time, whether other leadership structures might be appropriate for the Company. The Board has been and remains committed to maintaining strong corporate governance and appropriate independent oversight of management. Given that each of the members of the Board, other than Mr. Klein, is independent we believe that the leadership structure currently utilized by the Board provides effective independent Board leadership and oversight.
Pursuant to the Company’s Corporate Governance Principles,non-management directors of the Board are required to meet on a regularly scheduled basis without the presence of management. Thenon-executive Chairman of the Board leads these sessions. In addition, Board Committees also meet regularly in executive session without the presence of management.
The Board of Directors met fivesix times in 2016.2017. Each director attended at leastmore than 75% of the total meetings of the Board and committees of the Board of which the director was a member during 2016.2017. Pursuant to the Company’s Corporate Governance Principles, all directors are encouraged and expected to attend the Annual Meeting. All of the directors attended the Company’s 20162017 Annual Meeting of Stockholders.
The responsibility for theday-to-day management of risks lies with the Company’s management team; however, the Board has an active role, as a whole and also at the committee level, in overseeing the strategy and process for managing the Company’s risks. The Board regularly reviews information regarding the Company’s business strategy, leadership development, resource allocation, succession planning, credit, liquidity and operations, as well as the risks associated with each. The Company’s overall risk management program consists of periodic management discussions analyzing and mitigating risks, an annual review of risks associated with each of the Company’s operating businesses and an annual review of risks related to the Company’s compensation programs and practices.
CORPORATE GOVERNANCE (CONTINUED)
Annually, management identifies both external risks (i.e., economic) and internal risks (i.e., strategic, operational, financial and compliance), assesses the impact of these risks and determines how to mitigate such
CORPORATE GOVERNANCE (CONTINUED)
risks. The Audit Committee manages the Company’s risk management program and reviews the results of the annual assessment. Management also provides the Audit Committee with quarterly updates on the Company’s risks. In addition, the Audit Committee oversees management of the Company’s financial risks.
The Company’s Compensation Committee is responsible for overseeing the management of risks relating to the compensation paid to the Company’s executives and the Company’s executive compensation plans and programs.plans. Annually, the Compensation Committee’s independent compensation consultant conducts an assessment of the risks associated with the Company’s executive compensation practicespolicies and programs.practices. The compensation consultant conducts a more extensive review of all of the Company’s broad-based compensation incentive arrangements every threefew years. For more information about that assessment see “Compensation Risks” below.
The Nominating Committee manages risks associated with the independence of the Board, potential conflicts of interest of Board members, and the Company’s corporate governance structure, as well as management of risks associated with the environment, health and safety, diversity, philanthropy, global citizenship and sustainability.
While each committee is responsible for evaluating certain risks and overseeing the management of such risks, the entire Board is regularly informed through committee reports about all of the risks described above. The Board’s assignment of responsibility for the oversight of specific risks to its committees enables the entire Board, under the leadership of thenon-executive Chairman and the Chief Executive Officer, to better monitor the risks of the Company and more effectively develop strategic direction, taking into account the magnitude of the various risks facing the Company, including the magnitude of such risks.Company.
The Compensation Committee’s compensation consultant conducts an annual assessment of the risks associated with the compensation policies and practices used to compensate the Company’s executives and reports on the assessment to the Compensation Committee. In 2016,2017, the Compensation Committee, with assistance from its independent compensation consultant, reviewed the elements of executive compensation to determine whether any portion of executive compensation encouraged excessive risk taking and concluded that they do not. In general, the executive compensation arrangements are consistent with the structure and design of other companies of similar size and industry sector, and the following risk-mitigating design features have been incorporated into the Company’s programs:
The Company utilizes multiple long-term incentive vehicles with overlapping three year performance cycles;
The Company uses multiple and diverse performance metrics in incentive plans;
The upside on payout potential is capped for both short-term and long-term incentives;
The Company utilizes multiple long-term incentive vehicles, with PSAs that have overlapping three-year performance cycles;
The majority of an individual’s total compensation mix is not derived from a single component of compensation; and
The Company maintains stock ownership guidelines, a policy prohibiting hedging and pledging and a formal clawback policy.
As described in our Compensation Discussion and Analysis, compensation decisions are made using a combination of objective and subjective considerations designed to mitigate excessive risk taking by executives.
CORPORATE GOVERNANCE (CONTINUED)
The Board established an Audit Committee, a Compensation Committee, an Executive Committee and a Nominating and Corporate Governance Committee. A list of current Committee memberships may be found on the Company’s website athttp://ir.fbhs.com/committees.cfmcommittees.cfm. The Committee memberships as of the date of this Proxy Statement are set forth below:
| Name | Audit | Compensation | Executive | Nominating and Corporate Governance | ||||
Ann F. Hackett | C | X | X | |||||
Susan S. Kilsby | X | X | ||||||
Christopher J. Klein | X | |||||||
A. D. David Mackay | X | X | ||||||
John G. Morikis | X | X | ||||||
David M. Thomas | X | C | C | |||||
Ronald V. Waters, III | C | X | X | |||||
Norman H. Wesley | X | X |
An “X” indicates membership on the committee.
A “C” indicates that the director serves as the chair of the committee.
The Audit Committee’s primary function is to assist the Board in overseeing the (i) integrity of the Company’s financial statements, and the financial reporting process;process and the Company’s system of internal controls; (ii) Company’s compliance with legal and regulatory requirements; (iii) independence and qualifications of the Company’s external auditors; and (iv) performance of the Company’s external and internal auditors.auditors; and (v) the Company’s enterprise risk management program.
Each member of the Audit Committee (Messrs. Mackay, Morikis, Thomas, Waters and Wesley), is financially literate. Each of Messrs. Mackay, Thomas, Waters and Wesley has accounting or financial management expertise and is an audit committee financial expert as defined in Item 407(d)(5)(ii) and (iii) of RegulationS-K under the Exchange Act. As required by its charter, each Audit Committee member has also been determined by our Board to be independent as such term is defined in the Exchange Act and the New York Stock Exchange Listed Company Manual. The Audit Committee met eleventen times in 2016.2017.
The Compensation Committee’s primary functions arefunction is to assist the Board in attracting and retaining high quality leadership by (i) developdeveloping and critically reviewreviewing the Company’s executive compensation program design and pay philosophy and practices so that they are aligned with the Company’s business strategy;philosophy; and (ii) setsetting the compensation of the Company’s executive officers, which includes the presidents of the Company’s principal operating companies, in a manner that is consistent with competitive practices and individualCompany, operating company and Companyindividual performance.
As required by its charter, each member of the Compensation Committee (Messrs. Mackay, Morikis and Wesley and Mses. Hackett and Kilsby) has been determined by our Board to be independent as such term is defined in the Exchange Act and the New York Stock Exchange Listed Company Manual and pursuant to SEC regulations.Manual. The Committee has created a Subcommittee comprised of Mses. Hackett and Kilsby and Messrs. Mackay and Morikis that is responsible for approving all performance standards and payments for any pay program intended to qualify as “performance-based compensation” under Section 162(m) of the Internal Revenue Code (the “Code”). The Compensation Committee met five times in 2016.
Compensation Committee Interlocks and Insider Participation
Since January 1, 2016, none of the members of the Compensation Committee (i) served as one of the Company’s officers or employees; or (ii) had a relationship requiring disclosure under Item 404 of RegulationS-K.2017.
CORPORATE GOVERNANCE (CONTINUED)
Compensation Committee Interlocks and Insider Participation
None of the members of the Compensation Committee has (i) served as one of the Company’s officers or employees, or (ii) had a relationship requiring disclosure under Item 404 of RegulationS-K.
Compensation Committee Procedures
The Compensation Committee directs management to prepare financial data to be used by the Compensation Committee in determining executive compensation. In addition, members of the Company’s human resources department assist in the preparation of executive compensation tally sheets and historical information describing compensation paid to executives, program design and plan provisions and the Compensation Committee’s independent consultant provides market data for use in determining executive compensation. The Compensation Committee is presented with recommendations from management and from the Committee’s independent compensation consultant as to the level and type of compensation to provide to the Company’s executive officers. Members of the Company’s legal department provide the Compensation Committee with general advice on laws applicable to executive compensation and the directors’ fiduciary duties in setting compensation.
The Chief Executive Officer attends meetings of the Compensation Committee.Committee, except for portions of meetings where his performance or compensation is being discussed. The Chief Executive Officer’s feedback about each officer’s performance is essential in the Compensation Committee’s determination of the officer’s salary, target annual incentive and target incentivelong-term equity compensation determinations. See pages 18 through 3319-32 of this Proxy Statement for more information about how the Compensation Committee determined the executive officers’ compensation in 2016.2017.
Compensation Committee Consultant
The Compensation Committee engages an outside compensation consultant. Meridian Compensation Partners, LLC (“Meridian”) was retained directly by and reports directly to the Compensation Committee. In 2016,2017, Meridian provided the following services and information to the Compensation Committee:
Made recommendations as to best practices for structuring executive pay arrangements and executive compensation (including the amount and form of compensation) consistent with the Company’s business needs, pay philosophy, market trends and latest legal, regulatory and regulatorygovernance considerations;
Performed an assessment of the Company’s compensation peers and recommended changes;peers;
Provided market data (including compiling compensation data and related performance data) as background for decisions regarding the compensation of the Chief Executive Officer and other executive officers;
Performed an assessment of risks associated with the Company’s executive compensation structure and design; and
Attended Compensation Committee meetings (including executive sessions without the presence of management) and summarized alternatives for compensation arrangements that may have been considered in formulating final recommendations, as well as the consultant’s rationale for supporting or opposing management’s proposals.
The Compensation Committee has authorized Meridian to interact with management in connection with advising the Compensation Committee. Meridian is included in discussions with management on matters being brought to the Compensation Committee for consideration. Meridian is prohibited from performing any services for management outside of services needed in connection with advising the Compensation Committee.and Nominating Committees. The Compensation Committee has assessed Meridian’s independence and concluded that Meridian’s work for the Compensation Committee does not raise any conflict of interest.
CORPORATE GOVERNANCE (CONTINUED)
The Executive Committee did not meet in 2016.2017. The Executive Committee has all the authority of the full Board, except for specific powers that are required by law to be exercised by the full Board. The Executive Committee may not amend the Company’s charter, adopt an agreement of merger, recommend actions for stockholder approval, amend or repeal the Bylaws, elect or appoint any director or remove an officer or director, amend or repeal any resolutions of the Board, fix the Board’s compensation, and unless expressly authorized by the Board, declare a dividend, authorize the issuance of stock or adopt a certificate of merger.
CORPORATE GOVERNANCE (CONTINUED)
Nominating and Corporate Governance Committee
The Nominating Committee’s primary functions are to (i) provide recommendations to the Board with respect to the organization and function of the Board and its committees; (ii) recruit, identify and recommend potential director candidates and nominees; (iii) review the qualifications and independence of directors and provide recommendations to the Board regarding composition of the committees; (iv) develop a set ofand recommend changes to the Company’s corporate governance framework including the Company’s corporate governance principles; (iv)(v) oversee the process of the evaluation of the Board and management; and (v)(vi) review and advise management on matters relating to the Company’s responsibilities to its employees and the community. The Nominating Committee also makes recommendations to the Board regarding the level and composition of compensation fornon-employee directors and grants annual equity awards to non-employee directors.
As required by its charter, each member of the Nominating Committee (Messrs. Thomas and Waters and Mses. Hackett and Kilsby) has been determined by our Board to be independent as such term is defined in the Exchange Act and the New York Stock Exchange Listed Company Manual. The Nominating Committee met four times in 2016.2017.
Other Corporate Governance Resources
The Company’s Corporate Governance Principles, the Company’s Code of Business Conduct and Ethics and the Company’s Code of Ethics for Senior Financial Officers are available on the Company’s website athttp://ir.fbhs.com/corporate-governance.cfm. The charters of each committee are also available on the Company’s website athttp://ir.fbhs.com/committees.cfm.
In 2016,Fortune Brands is committed to attracting and retaining qualified and experienced directors that contribute to the Nominating Committee reviewed an analysisBoard’s effectiveness and the Company’s goal of outsidemaximizing stockholder value. To accomplish this, the Company maintains anon-employee director compensation prepared by Meridian. After reviewing the analysis, the Nominating Committee recommendedprogram that consists of cash fees and Company stock. During 2017, the Board approved an increase indid not make any changes to the structure of or the amounts provided under thenon-employee director annual cash fees from $80,000 to $90,000 and an increase in the valuecompensation program. Below is a description of the annual stock grant from $115,000 to $135,000. In addition, the Nominating Committee amended the Director Stock Ownership Guidelines to increase the multiple of the ownership requirement from 3 to 5 times the annual cash fee.non-employee director compensation program.
Beginning in July 2016,In 2017, the annual cash fee for services as anon-employee director of the Company was increased from $80,000 to $90,000. The members of the Audit Committee (Messrs. Mackay, Morikis, Thomas, Waters and Wesley) and the Compensation Committee (Mses. Hackett and Kilsby and Messrs. Mackay, Morikis and Wesley) receivereceived an additional annual cash fee of $7,500 for their service on each of these committees. In addition, the chairperson of each of the Audit, Compensation and Nominating Committees receivesreceived an additional annual cash fee of $15,000 for such service (Mr. Waters, Ms. Hackett and Mr. Thomas, respectively). Mr. Thomas receivesreceived an additional annual cash fee of $200,000 for his service asnon-executive Chairman of the Board. Directors may elect to receive payment of their cash fees in Company common stock rather than cash.
In April 2016,May 2017, eachnon-employee director received an annual stock grant that was based on a set dollar value of $135,000. The number of shares granted was determined by dividing the dollar value of the annual stock grant ($135,000) by the closing price of the Company’s common stock on the grant date ($57.37)63.32), rounded to the nearest share. Accordingly, 2,3532,132 shares of Company common stock were granted to each of the then-servingnon-employee directors. Directors may elect to defer receipt of their annual stock awards until the January following the year in which the individual ceases serving as a director of the Company.
Director Stock Ownership Guidelines
To further align the Board’s interests with those of stockholders, the Board establishedmaintains Stock Ownership Guidelines fornon-employee directors. In 2016, theThe guidelines were amended to encouragenon-employee directors to own Company common stock with a fair market value equal to five times their annual cash fee ($450,000 based on the annual fee of currently set at $90,000). The guidelines allow directors five years from the date of the director’s election to the Board to meet the guidelines. Directors with less than one year of service at the time of the increase of the multiple were given five years from the date of the amendment to meet the increased guidelines. All of our directors other than Ms. Kilsby, currently meet the multiple or fall within the five year time period allowed to meet the multiple under the Stock Ownership Guidelines. Ms. Kilsby has five years from the date of the amendment to meet the guidelines. For information about the beneficial ownership of the Company’s securities held by directors and executive officers, see “Certain Information Regarding Security Holdings” on pages 46 and 47.48-49.
Anti-Hedging and Anti-Pledging
The Company has a policy prohibiting directors (as well as senior management) from hedging the risk of owning Company common stock and from pledging or otherwise encumbering shares of Company common stock as collateral for indebtedness in any manner including, but not limited to, holding shares in a margin account.
DIRECTOR COMPENSATION (CONTINUED)
* Although Mr. Klein currently serves as a member of the Board, he does not receive any additional compensation for such service.
| (1) | Mr. Morikis elected to convert the cash fees he earned during the fourth quarter of 2017 to Company common stock pursuant to theNon-Employee Director Stock Election Program. |
| (2) | The amounts in this column represent the aggregate grant date fair value computed in accordance with Financial Accounting Standards Board Accounting Standards Codification Topic 718, Compensation — Stock Compensation (“FASB ASC Topic 718”). The grant date fair value was |
| Included in this column are premiums paid for group life insurance coverage and the Company’s match on gifts paid by the director to charitable organizations, both of which are generally available to Company employees, |
This Compensation Discussion and Analysis (“CD&A”) describes the Company’s executive compensation program and explains how the Compensation Committee made compensation decisions for the following Named Executive Officers (the “NEOs”) in 2016:2017:
Named Executive Officer | Position with the Company During | |
| Christopher J. Klein | Chief Executive Officer, Fortune Brands | |
| Senior Vice President and Chief Financial Officer, Fortune Brands | ||
| David M. Randich | President, MasterBrand Cabinets (“MBCI”) | |
| Nicholas I. Fink | President, Global Plumbing Group | |
| Robert K. Biggart | Senior Vice President, General Counsel and Secretary, Fortune Brands | |
| E. Lee Wyatt, Jr.* | Executive Vice President, Fortune Brands |
| * | Mr. Wyatt retired from the Company on December 31, 2017. He is included as an additional NEO because he served as the Company’s Chief Financial Officer through June 2017. Effective July 1, 2017, Mr. Hallinan assumed the role of the Company’s Chief Financial Officer. |
This CD&A is divided into the following main sections:
an Executive Summary;
the Results of the 20162017Say-on-Pay Vote;
a discussion of the Compensation Committee’s Philosophy and Process for Awarding NEO Compensation; and
a description of the Types and Amounts of NEO Compensation Awarded in 2016.2017.
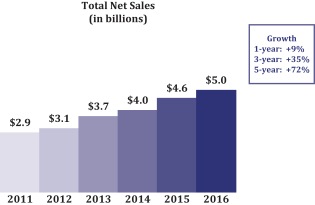
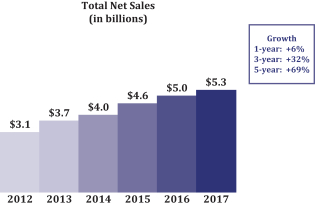
20162017 Business & Financial Highlights1
DeliveredIn 2017, we drove profitable growth and delivered increases on multiple key financial and efficiency measures in 2016 versus the prior year.measures. The measures marked with an * below are those that were linked to 20162017 executive compensation.
Net Sales increased 9%6% to $5.0$5.3 billion
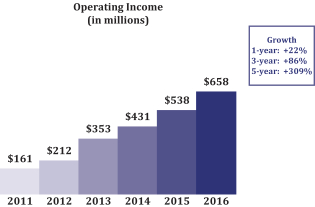
Operating Income (OI*) increased 22%10% to $657.8$725 million
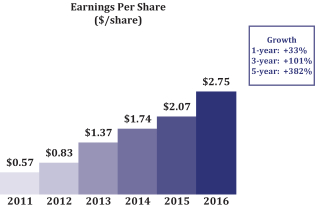
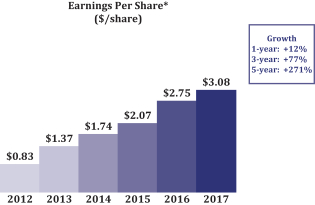
Earnings per share (EPS*) increased 33%12% to $2.75$3.08
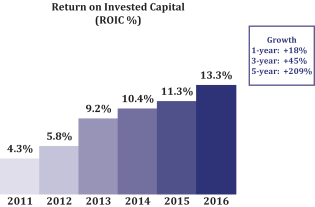
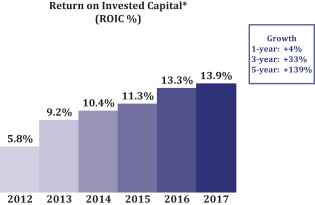
Return on Invested Capital (ROIC*) increased 200 basis points4% to 13.3%13.9%
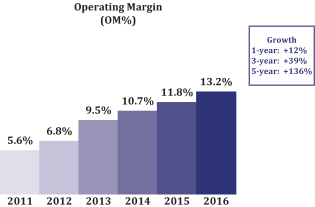
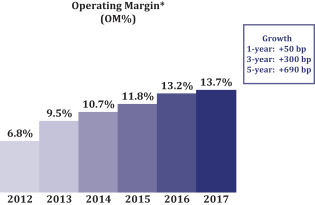
Operating Margin (OM*) increased 14050 basis points to 13.2%13.7%
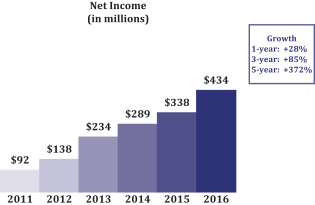
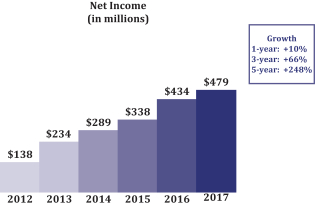
Net Income (NI) increased 28%10% to $434$479 million
Created the Global Plumbing Group (GPG), a new structure that paves the way for additionalGPG continued to drive growth through acquisitions, and joint ventures supported by our global supply chain and strong distribution.expanding its portfolio of brands
Completed the first two acquisitions under GPG by purchasing Riobel,purchase of Shaws of England, a UK premium Canadian showroom brandsink company, and ROHL,Victoria + Albert, a California-based luxury brand.UK premium free-standing bath tub company.
Joined the S&P 500 Index in June 2016.
The following charts show how Fortune Brands grew total shareholder return (TSR), net sales, operating income, earnings per share, return on invested capital, operating margin and net income in 2016. The Company has delivered substantial growth in these metrics since becoming an independent company in 2011. The Compensation Committee believes that the compensation earned by the NEOs in 2016 reflected the Company’s strong financial performance and continued execution against many of the metrics tied to increased shareholder value.
| 1 | All data presented in this CD&A is from continuing operations and all references to OI, EPS, ROIC, |
COMPENSATION DISCUSSIONAND ANALYSIS (CONTINUED)
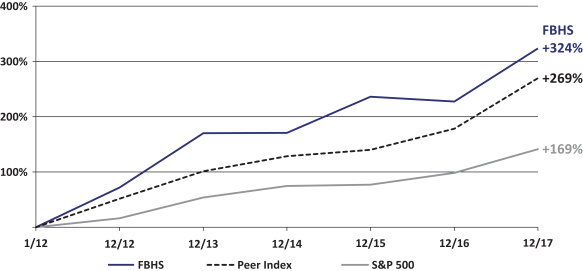
TOTAL SHAREHOLDER RETURN
(TSR %)
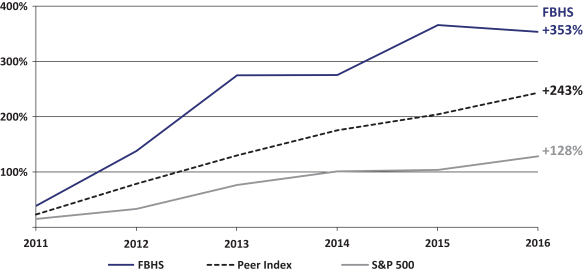
The chart abovebelow shows how Fortune Brands grew total shareholder return (TSR) and reflects the Company’s long-term stock price performance vs. publicly-traded companies in the Company’s 2017 Peer Group2 (see a list on page 23)24 for more information) since the Company’sspin-off from Fortune Brands, Inc. in 2011.
Total shareholder return (TSR)beginning of 2012. TSR has consistently exceeded relevant peerthe Company’s Peer Group and S&P 500 index performance over the long-term.
(TSR %)
The following charts show how the Company has delivered substantial growth in Net Sales, OI, EPS, ROIC, OM and NI since 2012. The compensation earned by the NEOs in 2017 reflected the Company’s strong financial performance in 2017 and continued execution against many of the metrics that the Compensation Committee believes are tied to increased shareholder value.
| 2 | Chart data from Bloomberg. |
COMPENSATION DISCUSSIONAND ANALYSIS (CONTINUED)
  |   |
  |   |
  |   |
COMPENSATION DISCUSSIONAND ANALYSIS (CONTINUED)
20162017 Compensation Highlights3
We use our compensation program to attract, motivate and retain the executives who lead our Company. The Compensation Committee has established programs and practices that are designed to pay for performance and to align management’s interests with those of the Company’s stockholders. We believe that our compensation program helps drive Company performance by providing a significant amount of compensation in the form of equity, by utilizing both short-term and long-term incentives that are tied to Company performance, and by making efforts to balance fixed (base salary) and variable (annual cash and equity incentives)equity) compensation. The 2016 executive compensation program was guided by the following principles:
Equity-based compensation aligns executives’ interests with stockholders, drives performance and facilitates retention of superior talent. We believe that equity-based compensation aligns the executives’ interests with those of our stockholders. In 2016, the annual equity grant made up 66% of Mr. Klein’s annual total target compensation and 54% (on average) of the other NEOs’ annual total target compensation. The Compensation Committee approved the following equity-based compensation, as part of the 2016 annual equity grants:
Annual equity awards consisted of performance share awards (PSAs), restricted stock units (RSUs) and stock options.
PSAs will be settled in Company stock only if the performance goals set for the cumulative three- year performance period are met. In 2016, the goals were based on EPS (weighted 75%) and ROIC (weighted 25%) for the period January 1, 2016 through December 31, 2018;
The RSUs granted in 2016 are time-vested awards that will be settled in Company stock, in three equal annual installments, assuming the NEO remains employed through each vesting date; and
Stock options allow the NEOs to purchase Company stock at the market price set on the grant date. The stock options granted in 2016 will vest in three equal annual installments, assuming the NEO remains employed through each vesting date, and expire ten years from the grant date.
Incentive compensation drives increasing profits and returns. The Compensation Committee continues to believe that linking compensation to certain performance metrics results in increased profits and stronger returns, which supports improving stockholder returns. The 2017 executive compensation program was guided by the following principles:
Equity-based compensation aligns executives’ interests with stockholders, drives performance and facilitates retention of superior talent.
In 2017, the annual equity grants represented 68% of Mr. Klein’s annual total target compensation and 55% (on average) of the other NEOs’ annual total target compensation.
In 2017, annual equity awards for NEOs consisted of performance share awards (PSAs), restricted stock units (RSUs) and stock options:
PSAs will settle in Company stock only if the minimum performance goals set for the cumulative three-year performance period are exceeded;
RSUs will settle in Company stock, in three equal annual installments, assuming the NEO remains employed through each vesting date; and
Stock options allow the NEO to purchase Company stock at the market price set on the grant date, vest in three equal annual installments, assuming the NEO remains employed through each vesting date, and expire ten years from the grant date.
Equity and Incentive compensation linked to increasing profits and returns.
The vast majority of compensation awarded to NEOs ispay-at-risk, or variable dependent upon Company performance. In 2016,2017, 86% of Mr. Klein’s annual total target compensation and 74% (on average) of the Compensation Committee modified the goals used for determiningother NEOs’ annual incentive awards and set challenging performance goals in connection with the annual incentive awards and PSAs:total target compensation waspay-at-risk.
2017-2019 PSAs are based on EBITDA (weighted 75%) and RONTA (weighted 25%) for the January 1, 2017 through December 31, 2019 performance period.
The Compensation Committee modified the annual incentive award goals by adding a third goal that focused onvalue of stock options increases only if the Company’s strategic initiatives to increase operating efficiency, margins and sales (see pages28-29 for further information about these changes). stock price increases after the date of grant.
The 2016 annual incentive awards were based on the following metrics:
The Company’s EPS, ROIC and Working Capital Efficiency (WCE) were metrics used for Messrs. Klein, Wyatt,Hallinan, Biggart and for a portion of the year, Fink;Wyatt;
MasterBrand Cabinets’ Operating Income (OI), Operating Margin (OM)MBCI’s OI, OM and WCE were metrics used for Mr. Randich; and
Moen’sGPG’s OI, Sales Growth Above Market (Sales) and WCE were metrics used for the portion of the year for Mr. Fink when he began serving as President of that business unit.Fink.
The metrics for three year PSAs were EPS and ROIC for all NEOs.
| 3 | Mr. Wyatt retired from the Company in December 2017. In anticipation of his retirement, Mr. Wyatt’s 2017 annual equity grant was comprised entirely of RSUs. Due to this difference in the equity mix compared to the other NEOs, all references to NEOs in this 2017 Compensation Highlights and in anypay-at-risk percentage shown throughout the CD&A exclude Mr. Wyatt. |
COMPENSATION DISCUSSIONAND ANALYSIS (CONTINUED)
Base salary represents the smallest portion of annual total target compensation.
The Compensation Committee continuously makes efforts to appropriately balance fixed (base salary) and variable (annual cash and equity incentives)equity) compensation for each NEO.NEO, while remaining competitive with the market.
In 2016, fixedFixed compensation represented 15% and variable compensation represented 85%14% of Mr. Klein’s annual total target compensation; and
In 2016, fixed compensation represented 27% (on average) and variable compensation represented 73%26% (on average) of the remaining NEOs’ 2017 annual total target compensation.
The following chart summarizes annual total target compensation awarded to each NEO in 2016:2017:
| Summary of 2016 NEO Annual Target Compensation | ||||||||||||||||||||||||||||||||
| Summary of 2017 NEO Annual Total Target Compensation | Summary of 2017 NEO Annual Total Target Compensation | |||||||||||||||||||||||||||||||
| Named Executive Officer | 2016 Annual Base Salary(1) | 2016 Annual Incentive Target Value | 2016Long- Term Incentive Award Target Value(2) | 2016 Total Target Compensation | 2017 Annual Base Salary(1) | 2017 Annual Incentive Target Value | 2017 Long- Term Incentive Award Target Value(2) | 2017 Total Target Compensation | ||||||||||||||||||||||||
Christopher J. Klein
| $1,100,000 | $1,430,000 | $5,000,000 | $7,530,000 | $1,135,000 | $1,475,500 | $5,500,000 | $8,110,500 | ||||||||||||||||||||||||
E. Lee Wyatt, Jr.
| $775,000 | $658,750 | $1,900,000 | $3,333,750 | ||||||||||||||||||||||||||||
Patrick D. Hallinan (3) | $550,000 | $412,500 | $1,250,000 | $2,212,500 | ||||||||||||||||||||||||||||
David M. Randich
| $590,000 | $413,000 | $1,250,000 | $2,253,000 | $615,000 | $492,000 | $1,325,000 | $2,432,000 | ||||||||||||||||||||||||
Nicholas I. Fink
| $510,000 | $331,500 | $1,050,000 | $1,891,500 | $535,000 | $401,250 | $1,100,000 | $2,036,250 | ||||||||||||||||||||||||
Robert K. Biggart
| $485,000 | $315,250 | $900,000 | $1,700,250 | $500,000 | $375,000 | $950,000 | $1,825,000 | ||||||||||||||||||||||||
E. Lee Wyatt, Jr. | $800,000 | $680,000 | $2,000,000 | $3,480,000 | ||||||||||||||||||||||||||||
| (1) | The amounts listed in this column reflect annual base salary effective March 1, |
| (2) | Includes the value of the annual target incentive equity awards, expressed as the aggregate grant date value of PSAs (at target), stock options and RSUs, as determined using the assumptions found in note 13 to the consolidated financial statement contained in the Company’s Form10-K for the year ended December 31, |
| (3) | The amounts shown reflect Mr. Hallinan’s annual total target compensation effective July 2017 when he assumed the role of Chief Financial Officer. |
The Board believes that this approach to our compensation program, along with our leading market positions and structural competitive advantages, hashave allowed our Company to continue to outperform the market for our products in the continued housing market recovery.
RESULTS OF THE 20162017SAY-ON-PAY VOTE
In 2016,2017, we sought an advisory vote from our stockholders on NEO compensation (commonly referred to as“Say-on-Pay”). More than 97%95% of the votes cast for theSay-on-Pay vote were in support of the Company’s executive compensation program.NEO compensation. Even with this strong endorsement of the Company’sthough our stockholders’ showed that they strongly endorsed our NEO pay practices, the Compensation Committee believes that it is essential to regularly reviewevaluated the executive compensation program. In 2016, the Compensation Committeeprogram and concluded that the compensation program provides rewards that it believes motivate our NEOs to maximize long-term stockholder value and encourage long-term retention. Accordingly, the Compensation Committee did not make any changes to the design of the Company’s executive compensation program in response to the 20162017Say-on-Pay vote. However,
Prior to the 2017Say-on-Pay vote, the Compensation Committee regularly evaluates the Company’s executive compensation programs and makes adjustments as it deems appropriate.
In 2016, the Compensation Committee changed the performance metrics useddecided to determine 2016 annual cash incentive awards (see pages28-29 for information about this change) and approved changes to the Company’s peer group to be used when evaluating 2017 executive compensation decisions (see pages 23-24 for information about this change).
In addition, at the end of 2016, the pension program, which Mr. Klein participated in, was frozen. In early 2017, the Compensation Committee also evaluatedchange the metrics used in the Company’s short-term and long-term incentive programs and changed the metrics for 2017-2019 PSAs whichfrom EPS to EBIDTA (weighted 75%) and from ROIC to RONTA (weighted 25%). This change eliminated anythe duplication that had historically been in our executive compensation program between the short-term and long-term performance metrics (see page 3029 for information about this change).
COMPENSATION DISCUSSIONAND ANALYSIS (CONTINUED)
PHILOSOPHY AND PROCESS FOR AWARDING NEO COMPENSATION
Philosophy of the Executive Compensation Program
We strongly believe that executive compensation should be closely tied to Company performance. Our executive compensation programs areprogram is designed to reward NEOs for the achievement of both short-term and long- termlong-term strategic and operational goals that lead to the creation of long-term stockholder value, while at the same time avoid incentives that encourage unnecessary or excessive risk taking. To accomplish this, the Compensation Committee has designed an executive compensation program that it believes:
Creates and reinforces apay-for-performance culture;culture by tying compensation to Company performance;
Aligns management’s interests with those of the Company’s stockholders;
Attracts, retains and motivates superior talent through competitive compensation;
Provides incentive compensation that promotes performance without encouraging excessive risk taking;risk-taking; and
Recognizes the cyclical nature of our business.
Maintaining a Competitive Compensation Program
Peer GroupsGroup and Market Data
When setting annual NEO compensation, the Compensation Committee uses compensation data from a group of similarly sized peer companies to evaluate compensation arrangements against those of the Company (the “Peer Group”). Annually, the Compensation Committee reviews and assesses the appropriateness of the Peer Group. The CompensationBased on Meridian’s recommendations, the Committee did not make anymade modifications to the composition of the Peer Group used for evaluating 20162017 executive compensation decisions.decisions by excluding Fastenal Company (due to the different nature of its business), companies that were not publicly-traded (Andersen Corporation, Kohler Co. and Pella Corporation) and companies that were acquired or pending acquisition (Jarden Corporation, Nortek, Inc. and Valspar Corporation). Eight new S&P 500 companies were added to the group based on their classification as cyclical companies with similar revenue and market capitalization that were more aligned with the Company. The Peer Group consisted of 19 consumer or housing product companies withreported a median 20152016 revenue of $4.16$6.24 billion and median 2015 market capitalization for publicly-traded peers of $6.21 billion which aligns with the Company’s 2015 revenue of $4.58 billion and 2015 market capitalization of $8.89$10.643 billion. The Peer Group consisted of the following companies:
| ||||
A.O. Smith Corporation | RPM International Inc. | |||
Armstrong World Industries, Inc. | Masco Corporation | The Sherwin-Williams Company | ||
Ball Corp.* | Mohawk Industries, Inc. | Snap-On Inc.* | ||
Borgwarner Inc.* | Newell Brands Inc. | Stanley Black & Decker, Inc. | ||
Ingersoll-Rand Plc* | Owens Corning Inc. | |||
| USG Corporation |
| ||||
| Denotes companies that were added to the 2017 Peer Group. |
Meridian provided the Compensation Committee with competitive data utilizing the Peer Group proxy datafor use in evaluating and Aon Hewitt provides revenuesize-adjusted competitive data from its general industry database. For Messrs. Klein and Wyatt, the Peer Group was the primary market data source for evaluating 2016setting NEO 2017 base salary, annual cash incentive awards and long-term incentive awards given(“market data”). When evaluating 2017 total target compensation, the availabilitymarket data primarily consisted of chief executive officer and chief financial officer compensationrevenue size-adjusted competitive general industry survey data in public filings,from Aon Hewitt, with the compensation surveyPeer Group proxy data providing a supplemental viewpoint. For our other NEOs, the Compensation Committee reviewed both the Peer Group proxy data, when available, and compensation survey data when evaluating the 2016 base salary, annual cash incentive awards and long-term incentive awards. Throughout the CD&A, the compensation data used by the Compensation Committee is referred to as “market data.”
COMPENSATION DISCUSSIONAND ANALYSIS (CONTINUED)
The Compensation Committee believes that compensation decisions are complex and require a deliberate review of Company performance, peer compensation levels, responsibilities of the role, experience of individual executives, and individual performance. In determining executive compensation, the Compensation Committee considers all forms of compensation and benefits, and uses appropriate tools – such as tally sheets and market data – to review the value delivered by each component of compensation to each executive. Accordingly, the Compensation
COMPENSATION DISCUSSIONAND ANALYSIS (CONTINUED)
Committee may determine that with respect to any individual it is appropriate for total target compensation or any particular element of compensation to meet, exceed or fall below the 50th percentile of the market data. The factors that might influence the amount of compensation awarded include market competition for a particular position, retention considerations, an individual’s performance, possession of a unique skill or knowledge set, proven leadership capabilities or other business experience tenure with the Company and internal pay equity.
Fortune Brands was added to the S&P 500 Index in June 2016. Due to this change and the Company’s continued revenue growth and increased market capitalization, the Compensation Committee engaged Meridian tore-evaluate the Company’s Peer Group to be used when evaluating 2017 executive compensation decisions. Based on Meridian’s recommendations, the Committee made modifications to the composition of the Peer Group by excluding Fastenal Company (due to the different nature of its business), companies that are not publicly-traded (Andersen Corporation, Kohler Co. and Pella Corporation) and companies that were recently acquired or pending acquisition (Jarden Corporation, Nortek, Inc. and Valspar Corporation). Eight new S&P 500 companies were added to the group based on their classification as cyclical companies with revenue (median 2015 revenue $6.18 billion) and market capitalization (median 2015 market capitalization $10.1 billion) more aligned to the Company. The 2017 Peer Group consisted of the following companies:
| ||||
| ||||
| ||||
| ||||
| ||||
| ||||
|
Evaluating NEO Performance
At the end of each year, the Compensation Committee, in conjunction with the othernon-management members of the Board, conducts a formal evaluation of the Company’s Chief Executive Officer (the “CEO”) to analyze his performance against strategic, financial and operational goals established at the beginning of the year. The Compensation Committee then sets the CEO’s annual total target compensation.compensation after reviewing related recommendations and market data from Meridian. The CEO reviews and evaluates each of the other NEOs relative to their performance against strategic, financial and operational goals established at the beginning of the year and then presents his evaluations to the Compensation Committee. The Compensation Committee evaluatesreviews the CEO’s recommendations and the market data from Meridian and then independently sets each of the other NEO’s annual total target compensation.
COMPENSATION DISCUSSIONAND ANALYSIS (CONTINUED)
Maintaining Best Practices Regarding Executive Compensation
The Compensation Committee maintains policies and procedures for itself and for certain executives of the Company’s executives,Company, including the NEOs, many of which it believes represent best practices in corporate governance.
| What We Do | ||
✓ Pay-for-PerformanceA significant portion of NEO annual total target compensation is tied to Company performance. In | ✓ ClawbackPolicyThe Company may recover all or part of annual cash incentives and equity incentive compensation under certain circumstances. | |
✓ AnnualAssessment and Mitigation of RisksThe Compensation Committee annually assesses whether our compensation programs, plans and awards are designed and working in a way that discourages excessive risk taking. | ✓ Double-Triggerin Change in ControlSeverance benefits are payable upon a change in control only if there is also a qualifying termination of employment. Our equity award agreements also include double-trigger provisions. | |
✓ MaximumPayouts on IncentivesAnnual cash incentive awards | ✓ TallySheetsTally sheets and wealth accumulation analyses are reviewed annually before making compensation decisions. | |
✓ StockOwnership GuidelinesWe maintain rigorous stock ownership guidelines for NEOs.
Executives are required to hold 50% of net shares from the vesting | ✓ IndependentCompensation ConsultantMeridian advises the Compensation Committee on executive compensation matters. Meridian is prohibited from performing services for management. | |
| What We Don’t Do | ||
× No Employment ContractsNEOs and other executive officers are employees “at will.” The Company does not have employment contracts with any of its NEOs or other executive officers. | × No Hedging or PledgingDirectors, NEOs and other officers are prohibited from hedging, pledging or otherwise encumbering shares of the Company’s common stock, including holding shares in a margin account. | |
× No Tax Gross UpsNEOs and other executive officers are not entitled to tax gross ups in the event of a change in control and related termination or for perquisites (other than relocation expenses). | × No Backdating or Repricing of Stock OptionsStock options are never backdated or issued with below-market prices. Repricing of underwater stock options without stockholder approval is prohibited (except in the event of certain extraordinary corporate events). | |
× No Excessive PerquisitesPerquisites are limited to the executive health program | ||
COMPENSATION DISCUSSIONAND ANALYSIS (CONTINUED)
TYPES AND AMOUNTS OF NEO COMPENSATION AWARDED IN 20162017
Summary of Executive Compensation Elements
As part of the 20162017 annual target compensation, the Company provided both fixed (base salary) and variable (annual cash incentive and equity incentives)equity) compensation to the NEOs. The vast majority of compensation is at risk to each NEO because the compensation that is actually paid is variable dependent upon Company (or individual operating company) performance and may vary from the target compensation that was awarded by the Compensation Committee and the payment is dependent upon Company (or individual operating company) performance or stock price performance. The amount of target total compensation at risk was significantly more than the amount of base salary for each NEO. Also, the majority of target total compensation awarded in 2016 to each NEO was in the form of equity.Committee. The following charts show each element of 20162017 annual target compensation, including the mix of short-term and long- term incentives, as well as the amount ofpay-at-risk for the CEO and the average for the other NEOs (on average). Retention awards are excluded from the chart.NEOs.
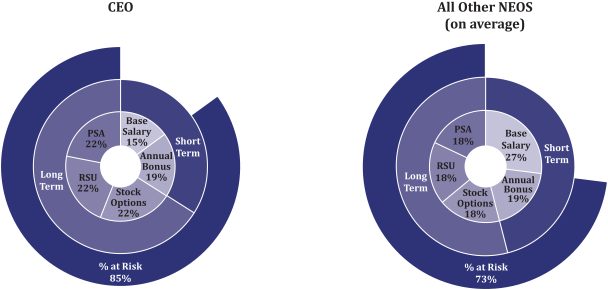
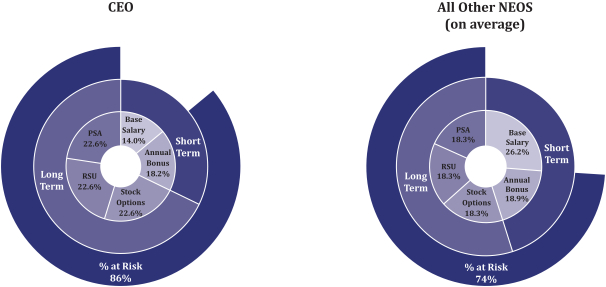
COMPENSATION DISCUSSIONAND ANALYSIS (CONTINUED)
The following chart summarizes the material elements of the Company’s 2016 executive compensation program. Further details regarding each of the elements are provided in the discussion that follows the chart.
| ||||||||||
|
|
|
|
| ||||||
| ||||||||||
|
|
| ||||||||
|
|
|
|
| ||||||
|
| |||||||||
|
|
| ||||||||
COMPENSATION DISCUSSIONAND ANALYSIS (CONTINUED)
Compensation Provided to NEOs in 20162017
Base Salary
We provide a portion of 2017 compensation in the form of base salary in order to attract, retain and motivate our NEOs. In setting 20162017 base salary levels, the Compensation Committee (together with Mr. Klein for the NEOs other than himself) considered competitive market data, the individual performance and the competitiveness of annual total directtarget compensation of each NEO. In 2016,For each of the NEOs received another than Mr. Hallinan, the annual base salary increases ranged from3.1-4.9%. Mr. Hallinan was promoted from chief financial officer of Moen to Senior Vice President – Finance of Fortune Brands in January, at which time he received an increase ranging from3.2-5.4%to his base salary of 17.7%. When he assumed the role of Chief Financial Officer of the Company in July, he received an additional increase to his base salary of 22.2%. Below is the 2017 and 2016 annual base salary for each NEO:
| NEO Base Salary | ||||||||||||||||||||
| Named Executive Officer | 2016 | 2015 | % Increase | 2017 | 2016 | |||||||||||||||
Christopher J. Klein | $1,100,000 | $1,060,000 | 3.8% | $1,135,000 | $1,100,000 | |||||||||||||||
E. Lee Wyatt, Jr. | $775,000 | $747,000 | 3.7% | |||||||||||||||||
Patrick D. Hallinan | $550,000 | $382,427 | ||||||||||||||||||
David M. Randich | $590,000 | $560,000 | 5.4% | $615,000 | $590,000 | |||||||||||||||
Nicholas I. Fink | $510,000 | $485,000 | 5.2% | $535,000 | $510,000 | |||||||||||||||
Robert K. Biggart | $485,000 | $470,000 | 3.2% | $500,000 | $485,000 | |||||||||||||||
E. Lee Wyatt, Jr. | $800,000 | $775,000 | ||||||||||||||||||
The Compensation Committee believes that annual cash incentive awards reinforce apay-for-performance culture because the payment is based on the Company’s financial results.results of the Company, or where applicable, our operating companies, and helps the Company maintain a competitive compensation program. Annually, the Compensation Committee sets thea target percentage of base salary used to determine each NEO’s cash incentive, as well as target, minimum and maximum performance goals for the Company and each operating company. The annual incentive payouts are based on the achievement of performance goals set at the beginning of the year and can range from 0% to 200%.incentive.
In 2016,2017, the Compensation Committee considered competitive market data and the individual performance of each of the NEOs and decided to increase the percentage of base salary used to determine Mr. Klein’s annual cash incentive award from 125% to 130%, Mr.Messrs. Randich’s, annual cash incentive award from 65% to 70%Fink’s and Mr. Biggart’s annual cash incentive award from 60% to 65%. These increases were madeby 10% to better align the annual cash incentivetheir awards to the market data for similar positions and were made in recognition of each individual’s performance. For Mr. Hallinan, his target percentage was set at 50% for the NEO’s performance.period January to June. When he assumed the role of Chief Financial Officer, his target percentage was increased to 75% for the period of July to December. As a result, Mr. Hallinan’s 2017 annual cash incentive award was prorated to reflect the portion of the year in which his target was set at 50% and 75%, respectively. The Compensation Committee did not to make any other increases in the percentages used to determine the annual cash incentive awards for the other NEOs.Messrs. Klein and Wyatt. The Compensation Committee believes that thetarget percentage of base salary levels were competitive compared to the market data. The percentage of base salary for each NEO for 20162017 was:
Named Executive Officer | Percentage of | |
| (as of 12/31/17) | ||
Christopher J. Klein | 130% | |
Patrick D. Hallinan | 75% | |
David M. Randich | 80% | |
Nicholas I. Fink | 75% | |
Robert K. Biggart | 75% | |
E. Lee Wyatt, Jr. | 85% | |
| ||
| ||
|
In 2016,Annually, the Compensation Committee decided to alteralso sets the performance goals used to determine annual cash incentive awards. The Compensation Committee decided to increase the number of performance metrics from two to three and refined the goals to increase focus on the Company’s strategic initiatives to increase operating efficiency, margins and sales. As a result, the 2016 performance goals used to determine annual incentive awards were set as follows:
For Messrs. Klein, Wyatt, Biggart and for a portion of the year, Mr. Fink, Fortune Brands’ EPS (weighted 60%), ROIC (weighted 20%) and company-wide WCE (weighted 20%), as compared to the 2015 performance goals of EPS (weighted 75%) and ROIC (weighted 25%).
For Mr. Randich, MasterBrand Cabinets’ OI (weighted 60%), OM (weighted 20%) and WCE (weighted 20%), as compared to the 2015 performance goals of OI (weighted 75%) and WCE (weighted 25%).
COMPENSATION DISCUSSIONAND ANALYSIS (CONTINUED)
For Mr. Fink, Moen’s OI (weighted 60%), Sales Above Market (weighted 20%) and WCE (weighted 20%) for the portion of the year that he served as President of Global Plumbing Group, as compared to Moen’s 2015 performance metrics of OI (weighted 75%) and RONTA (weighted 25%).
The Compensation Committee believed that including a WCE goal reflects the importance of increasing efficiency and inventory control throughout the Company, using an OM goal for MasterBrand Cabinets focuses executives on increasing our businesses operating efficiency and pricing strategies and using a Sales Above Market goal (Sales) for Moen reflects the importance of increasing sales of our most profitable business. The Compensation Committee believes that these metrics focus executives on maximizing long-term stockholder value (EPS), operational efficiency (ROIC, OM and WCE) and profitability (OI, OM and Sales).
The Compensation Committee set minimum, target and maximum annual performance metrics and goals used to determine each NEO’s annual cash incentive award. The annual incentive payouts are based on the achievement of the performance goals and can range from 0% to 200% of target. To establish challenging performance goals under the annual incentive program, the Compensation Committee reviewed the target performance goals and actual results for awards paid in 20152016 and considered its 2016the 2017 expected growth rate in the
COMPENSATION DISCUSSIONAND ANALYSIS (CONTINUED)
home products market as well as key assumptions relating to share gains, pricing, material inflation and productivity. No changes were made to the types of performance measures used to determine 2017 annual incentive awards as compared to 2016, which were as follows:
For Messrs. Klein, Hallinan, Biggart and Wyatt, Fortune Brands’ EPS (weighted 60%), ROIC (weighted 20%) and company-wide WCE (weighted 20%);
For Mr. Randich, MBCI’s OI (weighted 60%), OM (weighted 20%) and WCE (weighted 20%); and
For Mr. Fink, GPG’s OI (weighted 60%), Sales (weighted 20%) and WCE (weighted 20%).
The performance goals, at the minimum, targetCompensation Committee believes that these measures focus executives on maximizing long-term stockholder value (EPS), operational efficiency (ROIC, OM and maximum payout levels, were intended to be challengingWCE) and required superior performance.profitability (OI, OM and Sales). The following table sets forth the minimum, target and maximum performance measures, the actual performance results, the percentage payout and the amountsamount paid to each NEO for the 20162017 annual cash incentive awards:
| 2016 Annual Cash Incentive Performance Goals and Results | ||||||||||||||||||
Performance Measures and Goals(1) | Results and Award | |||||||||||||||||
| Named Executive Officer | Performance Measures | Target Performance Measure | Actual Performance(2) | % of Payout | Amount Paid | |||||||||||||
Christopher J. Klein | EPS | $2.46 | $2.60 | 113.9 | % | $ | 1,628,770 | |||||||||||
| ROIC WCE | | 12.3% 15.2% |
| | 12.5% 15.0% |
| ||||||||||||
E. Lee Wyatt, Jr. | EPS | $2.46 | $2.60 | 113.9 | % | $750,316 | ||||||||||||
| ROIC WCE | | 12.3% 15.2% |
| | 12.5% 15.0% |
| ||||||||||||
David M. Randich(3) | OI | $283 | $260.3 | 91.3 | % | $ | 377,069 | |||||||||||
| OM WCE | | 11.2% 12.1% |
| | 10.9% 11.9% |
| ||||||||||||
Nicholas I. Fink(4) | EPS | $2.46 | $2.60 | 113.9 | % | $ | 355,841 | |||||||||||
| ROIC WCE | | 12.3% 15.2% |
| | 12.5% 15.0% |
| ||||||||||||
| OI Sales(5) WCE | | $314.1 1.5% 16.9% |
| | $332.1 0% 16.3% |
| 98.9 | % | ||||||||||
Robert K. Biggart | EPS ROIC WCE | | $2.46 12.3% 15.2% |
| | $2.60 12.5% 15.0% |
| 113.9 | % | $ | 359,070 | |||||||
(1) OI minimum, target and maximum performance measures and actual performance results are shown in millions.
(2) EPS, ROIC, OI and OM actual performance were adjusted to exclude the effect of currency fluctuations.
(3) Mr. Hallinan’s award was prorated based on 50% of his base salary for the period January 1 – June 30, 2017 and 75% of his base salary for the period July 1 – December 31, 2017.
(4) Mr. Randich’s goals related to MBCI’s performance.
(5) Mr. Fink’s goals related to GPG’s performance.
(6) Sales Growth Above Market was determined by calculating the percentage change in GPG’s annual sales in excess of the percentage change in the plumbing market’s prior year sales.
COMPENSATION DISCUSSIONAND ANALYSIS (CONTINUED)
Long-Term IncentiveEquity Awards
The Compensation Committee believes that equity awards both aligncompensation aligns management’s interests with those of stockholders, and reinforcereinforces apay-for-performance culture. The 2016culture and helps the Company maintain a competitive compensation program. Annually, the Compensation Committee sets a target equity-based compensation represented 66%equity award value and determines the types of Mr. Klein’s and 54% (on average) of the other NEOs’ annual total target compensation.equity to award.
In setting 20162017 target long-term incentive awards,equity award values, the Compensation Committee (together with Mr. Klein for NEOs other than himself) considered competitive market data, the individual performance and the competitiveness of total direct compensation of each of the NEOs. In addition, Messrs.Mr. Klein’s and Randich’s target long-term equity award value werewas increased to reward their individualby ten percent (10%) in recognition of his performance and to better align their long-term incentive compensationwith the market data. Mr. Hallinan received an increase in his annual equity award value due to his promotion in January 2017. When he assumed the role of Chief Financial Officer in July 2017, he was granted an additional equity award to bring his total 2017 award value in line with the market data for similar positions. Thehis position.Below is the 2017 target equity award value and the 2016 target award value for each NEO:
For each NEO (other than Mr. Wyatt), the 2017 target long-term incentiveequity award value of each NEO’s 2016 equity-based awards was as follows and was comprised equally of PSAs (with the PSAs valued assuming achievement of the target performance level), RSUs and stock options:options. Given Mr. Wyatt’s planned retirement at the end of 2017, his annual equity award was comprised solely of RSUs which vested on December 31, 2017, subject to his continued employment. For the remainder of this section, references to the NEOs excludes Mr. Wyatt because of the different mix of equity granted to him.
| Named Executive Officer | 2016 Equity Award Value | 2015 Equity Award Value | % Increase | |||||||||
Christopher J. Klein | $5,000,000 | $4,615,000 | 8.3% | |||||||||
E. Lee Wyatt, Jr. | $1,900,000 | $1,850,000 | 2.7% | |||||||||
David M. Randich | $1,250,000 | $1,100,000 | 13.6% | |||||||||
Nicholas I. Fink | $1,050,000 | $1,000,000 | 5% | |||||||||
Robert K. Biggart | $900,000 | $850,000 | 5.9% | |||||||||
Performance Share Awards:In 2016,one-third of the total target long-term incentive award value grantedPSAs awarded to the NEOs was made in the form of PSAs. The PSAs2017 will be settled in shares of the Company’s common stock only if the Company achievesexceeds specified EPS (weightedEBITDA (earnings before interest, tax, depreciation and amortization), weighted 75%), and ROIC (weightedRONTA (return on net tangible assets), weighted 25%), performance goals during the cumulative performance period from January 1, 20162017 through December 31, 2018, with vesting ranging2019. Payouts will range from 0% to 200% of the target award based on performance. No shares will be paid unless the minimum established performance goals are achievedexceeded and payout, if any, will not occur until early in 2019,2020, following completion of the performance period and certification of the performance results by the Compensation Committee.
In 2017, the Compensation Committee evaluated the metrics used by the Company and the Peer Group companies and decided to change the performance metrics used to determine the long-term equity awards granted in 2017 to be based on EBITDA and RONTA. This change in long-term goals eliminated the duplication that previously existed between the Company’s short-term and long-term performance metrics. The Compensation Committee based the performance goals on EBITDA and RONTA because it believes that these metricsincentivize management to grow earnings in a focused and efficient way that rewards operating excellence and aligns the interests of management with our stockholders.
The EPSEBITDA and ROICRONTA goals were intended to be challenging and require superior performance at the minimum, target and maximum payout levels.challenging. The Compensation Committee believes that awarding PSAs with a cumulative three year performance goal drives long-term sustained growth and, as a result, management is rewarded if the long-term growth goals are met or exceeded. In establishing performance goals for PSAs, the Compensation Committee considered the Company’s strategic operating plan, the expected3-year compound market growth rate, as well as key assumptions relating to share gains, pricing, material inflation and productivity.
RSUs and Stock Options:The Compensation Committee based the performance goals on EPS and ROIC because it believes that these metrics are core drivers of the Company’s performanceboth RSUs and stock options focus management on increasing stockholder returns and further align the interests of management with the interest of our stockholders. While EPS and ROIC are utilized in both short-term and long-term incentive awards, the short-term incentive awards include an additional operational metric (Working Capital Efficiency). The short-term incentive awards were based 60% on EPS, 20% on ROIC and 20% on WCE over a one year period. The long-term incentive awards were based on 75% on EPS and 25% ROIC over a cumulative three year period. The Compensation Committee based the performance goals on EPS and ROIC because it believed that the combined use of these metrics reflect sustainable growth and stronger returns.
The Compensation Committee annually evaluates and approves the metrics used in the Company’s short-term and long-term incentive compensation programs. In February 2017, the Compensation Committee evaluated the metrics used by the Company and its peers and decided to change the performance metrics used to determine the long-term incentive awards granted in 2017 to be based on EBITDA (earnings before interest, tax, depreciation and amortization) weighted 75% and RONTA (return on net tangible assets) weighted 25%, each over a cumulative three year period. This change in long term goals eliminated any duplication that existed in prior awards between the short-term and long-term performance metrics.
COMPENSATION DISCUSSIONAND ANALYSIS (CONTINUED)
RSUs and Stock Options:One-third of the total target long-term incentive award value grantedawarded to the NEOs in 2016 was made in the form of RSUs andone-third was made in the form of stock options. The Compensation Committee believes that both RSUs and stock options further focus management on increasing stockholder returns and align the interests of management with stockholders.
RSUs awarded as part of the 2016 annual equity grant, vest in three equal annual installments, assuming the NEO remains employed through each annual vesting date. RSUs serve as a long-term retention device in a cyclical business, as an executive must remain employed with the Company through each of the three annual vesting dates to receive all of the shares. The Compensation Committee also believes that the value of RSUs is at risk to the NEOs because the value of RSUs will fluctuate based on the Company’s stock price and only grows when the Company’s long-term stock price increases.
Stock options granted in 20162017 vest in three equal annual installments, assuming the NEO remains employed through each annual vesting date, and expire ten years from the date of grant. The Compensation Committee believes that stock options are performance-based because the value of stock options grows when the Company’s long-term stock price increases. The value of stock options is at risk to the NEOs as they only realize a value ifto the extent the Company’s stock price increases after the grant date.
Retention Equity Award
In March 2016, the Compensation Committee granted 40,000 RSUs (with a grant date value of $2,047,000) to Mr. Wyatt as a retention device. The Compensation Committee believes that this equity award will serve to retain Mr. Wyatt through each of the three vesting dates as he helps in the transition to a new chief financial officer upon his retirement. For this award, the Compensation Committee approved the following vesting schedule: 25% of the award vested in December 2016, 25% will vest in June 2017 and the remaining fifty 50% percent will vest in December 2017.
2014-20162015-2017 Performance Share Awards Payout
In 2014,2015, the Compensation Committee awarded all of the then-serving NEOs PSAs to be settled in early 20172018 if the Company achieved certain EPS and ROIC goals during the cumulative performance period from January 1, 20142015 through December 31, 2016,2017, with EPS weighted 75% and ROIC weighted 25%. The Compensation Committee certified a payout level of 80.9%162.3%. The threshold, target and maximum goals for cumulative EPS and average ROIC from January 1, 20142015 through December 31, 20162017 and the Company’s actual results were as follows:
2014-2016 PSA Target EPS and ROIC Goals and Results | ||||||||||||||||
2015-2017 PSA Target EPS and ROIC Goals and Results | 2015-2017 PSA Target EPS and ROIC Goals and Results | |||||||||||||||
| Metric | Target | Actual Performance | % of Payout | Threshold | Target | Maximum | Actual Performance | % of Payout | ||||||||
EPS (75%) | $6.77 | $6.56 | 80.9% | $6.51 | $7.22 | $7.97 | $7.90 | 162.3% | ||||||||
ROIC (25%) | 12.4% | 11.7% | 11.9% | 13.2% | 14.5% | 12.9% | ||||||||||
Based on the achievement of the 2014-20162015-2017 EPS and ROIC performance goals, all of the eligible NEOs received the following number of shares of Company common stock pursuant to the terms of the award agreements:
Named Executive Officer | Shares Granted | |||
Christopher J. Klein | ||||
Patrick D. Hallinan | 3,408 | |||
David M. Randich | 12,497 | |||
Nicholas I. Fink | 11,685 | |||
Robert K. Biggart | 9,575 | |||
E. Lee Wyatt, Jr. | ||||
| ||||
| ||||
COMPENSATION DISCUSSIONAND ANALYSIS (CONTINUED)
Benefits
Retirement
All of the NEOs are eligible for retirement benefits through the Fortune Brands Home & Security Retirement Savings Plan (the “Savings“Qualified Savings Plan”), atax-qualified defined contribution 401(k) plan. The Compensation Committee believes that the Qualified Savings Plan benefits are consistent with competitive pay practices and are an important element in attracting and retaining talent in a competitive market.
Mr. Klein is the only NEO eligible for retirement benefits through the Moen Incorporated Pension Plan, atax-qualified defined benefit pension plan. Benefit accruals under the Moen Incorporated Pension Plan were frozen effective January 1, 2017, which means that participants, including Mr. Klein, no longer accrue additional benefits. Due to their respective hire and/or transfer dates, Messrs. Wyatt, Randich, Fink and Biggart are not eligible to participate in any of the Company’stax-qualified defined benefit plans. In addition to itstax-qualified plans,the Qualified Savings Plan, the Company providesnon-qualified supplemental retirement benefits for accruals or contributions that would have been made under thetax-qualified plansplan but for limitations imposed by the Code. Please see the narratives that followand the “2016 Pension Benefits”“2017 Nonqualified Deferred Compensation” table on pages 38-39 of this Proxy Statement for further information regarding these retirement plans. benefits.
The Company also providesmaintains a frozentax-qualified defined benefit pension plan and anon-qualified deferred compensation plan,defined benefit pension plan. Benefit accruals were frozen on December 31, 2016, which allows executives to defer a portion of their cash compensation and RSU awards, however, none of the NEOs elected to make any deferrals in 2016.means that participants, including Mr. Klein, no longer accrue additional benefits.
COMPENSATION DISCUSSIONAND ANALYSIS (CONTINUED)
Severance
The Company has Agreements for the Payment of Benefits Following Termination of Employment (the “Severance Agreements”) with each NEO. Under the terms of the Severance Agreements, each NEO is entitled to severance benefits upon a qualifying termination of employment (i.e., termination by the Company without “cause” or by the NEO for “good reason”). or in the event of a termination following a change in control.
The Compensation Committee believes that it is appropriate to provide NEOs with the protections afforded under these Severance Agreements help accomplishand that doing so helps the Company’s compensation objectives of attractingCompany remain competitive with market practice and retainingattract and retain superior talent. The Compensation Committee also believes that it is appropriate to provide executives with the protections afforded by these Severance Agreements and that these Severance Agreements promote management independence and help focus the attention of executive officerskeeps management focused on the Company’s business in the eventface of aany potential change in control.control events.
All of the Agreements contain “double-trigger” change in control provisions, which means that there must be both a change in control of the Company (or applicable operating company) and a qualifying termination of employment (i.e., termination by the Company without “cause” or by the NEO for “good reason”) before any enhanced benefits can be paid following a change in control. The NEOs are not entitled to any tax gross ups under the Severance Agreements, including those related to the “golden parachute”change-in-control related excise taxtaxes under the Code. Please see the “Potential Payments Upon Termination or Change in Control” table, as well as the narratives that follow for further information regarding the Severance Agreements and the treatment of outstanding equity upon a qualifying termination of employment or a change in control on pages 40 to- 42.
Perquisites
The Company provides a limited number of perquisites. The Compensation Committee authorizedperquisites, which include limited annual use of Company aircraft by Messrs. Klein and Wyatt. In 2016, Mr. Klein and Mr. Wyatt (the cost of which is reimbursed by the Company for any personal use of Company aircraft, equivalent in amount toexecutive based on the cost of a first class ticket for each passenger on these flights. The Company’sairplane ticket) and an executive health program makesthat provides NEOs with annual medical examinations available to certain executives, including each of the NEOs, because the health of the NEOs is important to the Company.examinations. The Company also provides broad-based plans which are generally available to employees such as reimbursement of certain relocation expenses incurred when the Company requires an employee to relocate, a match on charitable contributions and company product purchase programs.
COMPENSATION DISCUSSIONAND ANALYSIS (CONTINUED)
Policies
Clawback Policy
The Company has a policy that allows it to recoup all or part of annual cash incentives or PSAs if there is a:
(1) significant or material restatement of the Company’s financial statements covering any of the three fiscal years preceding the grant or payment, or (2) restatement of the Company’s financial statements for any such year which results from fraud or willful misconduct committed by an award holder. The Company also includes the right to recoup all or part of an executive’s other equity awards in the terms and conditions of thethese awards.
Stock Ownership Guidelines
The Company maintains the following stock ownership guidelines for NEOs and other Company executives, which require them to hold a number of shares equal to a multiple of their annual base salary. The ownership guidelines are as follows:
Position | Stock Ownership Level as a Multiple of Base Salary | |||
Chief Executive Officer | 6 | |||
Chief Financial Officer | ||||
Operating Company Presidents | 3 | |||
Senior Vice Presidents | 3 | |||
Vice Presidents | 1 | |||
COMPENSATION DISCUSSIONAND ANALYSIS (CONTINUED)
Executives have five years from the date of hire or date of promotion to acquire the requisite amount of stock and are required to hold 50% of net shares acquired from the vesting of PSAs orand RSUs until the ownership guidelines are met. All of the NEOs currently satisfymeet the multiple or fall within the time period allowed to meet the multiple under the stock ownership guidelines. Mr. Hallinan has five years from the date of his appointment as Chief Financial Officer to meet the requirement.
The Compensation Committee has reviewed and discussed the Compensation Discussion and Analysis with management and, based on the review and discussions, the Compensation Committee recommended to the Board that the Compensation Discussion and Analysis be included in the Company’s Proxy Statement and the Company’s Annual Report on Form10-K for the year ended December 31, 2016.2017.
Compensation Committee
Ann F. Hackett, Chair
Susan S. Kilsby
A. D.A.D. David Mackay
John G. Morikis
Norman H. Wesley
| * | Mr. |
| ** | Mr. Wyatt served as Senior Vice President |
| (1) | Stock Awards:The amounts listed in column D for |
| The amounts included in this column for the PSAs granted during |
| (2) | Option Awards:The amounts listed in column E for |
| (3) | Non-Equity Incentive Plans:Column F lists amounts earned as annual cash incentives. |
| (4) | Change in Actuarial Value of Pension Benefits:Column G includes the change in actuarial value of Mr. Klein’s and Mr. Hallinan’stax-qualified andnon-qualified defined benefit pension |
| (5) | Perquisites and All Other Compensation:The amounts in column H include the following: |
| (a) | Matching Contributions to the Savings Plan. Matching contributions for |
| (b) | Profit Sharing Contributions to the Savings Plan.Profit sharing contributions for |
| (c) | ProfitSharingContributionsto |
| (d) | Premiums for Life |
2017 EXECUTIVE COMPENSATION (CONTINUED)
| (e) | Other:In |
In 2017, limited use of the Company’s aircraft was provided to Messrs. Klein and Wyatt, who each reimbursed the Company for their personal use in an amount equivalent to the cost of a first class ticket for each passenger on these flights. The calculation of incremental cost of personal aircraft usage is based on variable costs to the Company, including fuel costs, crew expenses, landing fees and other miscellaneous variable costs. In 2017, the Company’s incremental cost for personal use of Company aircraft not reimbursed by Mr. Klein was $206,762 and by Mr. Wyatt was $86,497, which amounts are reflected in column H.
Also included in column H for each NEO are costs associated with the Company’s executive health program.
2016 EXECUTIVE COMPENSATION (CONTINUED)
| (1) | For stock options awarded on February |
| (2) | Amounts in this row reflect the range of potential payments under the Fortune Brands Home & Security, Inc. Annual Executive Incentive Compensation Plan. The target payout for Messrs. Klein, |
2017 EXECUTIVE COMPENSATION (CONTINUED)
| (3) | This row reflects the number of stock options granted under the |
| (4) |
| (5) | The amounts in this row reflect the range of potential payouts for PSAs that were |
2016 EXECUTIVE COMPENSATION (CONTINUED)
| (1) | Each outstanding stock option granted that was vested and exercisable on December 31, |
| (2) | Each outstanding stock option that was not yet vested and exercisable on December 31, |
| Number of Stock Options Vesting by Year | ||||||||||||
| Name | 2017 | 2018 | 2019 | |||||||||
Christopher J. Klein | 123,967 | 87,900 | 43,733 | |||||||||
E. Lee Wyatt, Jr. | 49,101 | 34,333 | 16,633 | |||||||||
David M. Randich | 30,167 | 21,466 | 10,933 | |||||||||
Nicholas I. Fink | 19,200 | 19,200 | 9,200 | |||||||||
Robert K. Biggart | 22,967 | 15,999 | 7,867 | |||||||||
2016 EXECUTIVE COMPENSATION (CONTINUED)
| Number of Stock Options Vesting by Year | ||||||||||||
| Name | 2018 | 2019 | 2020 | |||||||||
Christopher J. Klein | 133,336 | 89,168 | 45,436 | |||||||||
Patrick D. Hallinan | 15,659 | 12,790 | 9,958 | |||||||||
David M. Randich | 32,412 | 21,879 | 10,946 | |||||||||
Nicholas I. Fink | 28,287 | 18,287 | 9,087 | |||||||||
Robert K. Biggart | 23,847 | 15,715 | 7,848 | |||||||||
| (3) | Each outstanding RSU that had not yet vested as of December 31, |
| Number of RSUs Vesting by Year | Number of RSUs Vesting by Year | |||||||||||||||||||||||
| Name | 2017 | 2018 | 2019 | 2018 | 2019 | 2020 | ||||||||||||||||||
Christopher J. Klein | 31,900 | 21,666 | 10,933 | 32,236 | 21,502 | 10,569 | ||||||||||||||||||
E. Lee Wyatt, Jr. | 42,667 | 8,466 | 4,167 | |||||||||||||||||||||
Patrick D. Hallinan | 3,667 | 2,967 | 2,267 | |||||||||||||||||||||
David M. Randich | 32,767 | 17,800 | 15,233 | 20,347 | 17,779 | 2,546 | ||||||||||||||||||
Nicholas I. Fink | 12,666 | 12,667 | 2,300 | 14,781 | 4,414 | 2,114 | ||||||||||||||||||
Robert K. Biggart | 5,900 | 3,933 | 1,967 | 5,759 | 3,792 | 1,826 | ||||||||||||||||||
| (4) | This column reflects the value of the outstanding RSUs that have not yet vested (using the December |
| (5) | The amounts reported in this column are based on achieving target performance goals for PSAs granted in |
| Number of PSAs Outstanding by Performance Period | Number of PSAs Outstanding by Performance Period | |||||||||||||||
| Name | 2015-2017 | 2016-2018 | 2016-2018 | 2017-2019 | ||||||||||||
Christopher J. Klein | 32,200 | 32,800 | 32,800 | 31,708 | ||||||||||||
E. Lee Wyatt, Jr. | 12,900 | 12,500 | ||||||||||||||
Patrick D. Hallinan | 2,100 | 6,801 | ||||||||||||||
David M. Randich | 7,700 | 8,200 | 8,200 | 7,639 | ||||||||||||
Nicholas I. Fink | 7,200 | 6,900 | 6,900 | 6,342 | ||||||||||||
Robert K. Biggart | 5,900 | 5,900 | 5,900 | 5,477 | ||||||||||||
E. Lee Wyatt, Jr. | 12,500 | 0 | ||||||||||||||
| (6) | This column reflects the value of the PSAs (using the December |
2017 EXECUTIVE COMPENSATION (CONTINUED)
| 2016 OPTION EXERCISES AND STOCK VESTED | ||||||||||||||||
| Option Awards | Stock Awards | |||||||||||||||
| Name | Number of Shares Acquired on Exercise (#)(1) | Value Realized Upon | Number of Shares Acquired on Vesting (#)(3) | Value Realized on Vesting ($)(4) | ||||||||||||
Christopher J. Klein | 380,000 | 18,021,202 | 57,836 | 3,044,599 | ||||||||||||
E. Lee Wyatt, Jr. | 150,000 | 7,693,471 | 33,959 | 1,799,610 | ||||||||||||
David M. Randich | 130,600 | 5,511,144 | 13,985 | 736,088 | ||||||||||||
Nicholas I. Fink | 0 | 0 | 10,367 | 655,091 | ||||||||||||
Robert K. Biggart | 0 | 0 | 14,039 | 756,917 | ||||||||||||
| 2017 OPTION EXERCISES AND STOCK VESTED | ||||||||||||||||
| Option Awards | Stock Awards | |||||||||||||||
| Name | Number of Shares Acquired on Exercise (#)(1) | Value Realized Upon Exercise ($)(2) | Number of Shares Acquired on Vesting (#)(3) | Value Realized on Vesting ($)(4) | ||||||||||||
Christopher J. Klein | 275,000 | $14,242,812 | 84,160 | $5,421,451 | ||||||||||||
Patrick D. Hallinan | 0 | $0 | 5,375 | $346,995 | ||||||||||||
David M. Randich | 48,800 | $1,695,031 | 45,264 | $2,897,960 | ||||||||||||
Nicholas I. Fink | 0 | $0 | 24,351 | $1,614,191 | ||||||||||||
Robert K. Biggart | 0 | $0 | 15,475 | $996,510 | ||||||||||||
E. Lee Wyatt, Jr. | 40,000 | $2,047,012 | 110,826 | $7,418,535 | ||||||||||||
| (1) | This column reflects the number of stock options exercised during |
| (2) | This column reflects the difference between the market value of the shares on the date of exercise and the exercise price of the stock options. |
| (3) | This column reflects the number of |
| (4) | This column reflects the value of RSUs calculated using the market value of the shares |
2016 EXECUTIVE COMPENSATION (CONTINUED)
RETIREMENT AND POST-RETIREMENT BENEFITS 2016 PENSION BENEFITS | ||||||||||||||
| Name | Plan Name | Number of Years Credited Service (#) | Present Value of (2)(3) | Payments During Last Fiscal Year(4) | ||||||||||
Christopher J. Klein | Moen Incorporated Pension Plan(1) | 13.75 | $ | 430,000 | 0 | |||||||||
| Fortune Brands Home & Security, Inc. Supplemental Retirement Plan | 13.75 | $ | 3,604,000 | 0 | ||||||||||
E. Lee Wyatt, Jr. | None | N/A | N/A | 0 | ||||||||||
David M. Randich | None | N/A | N/A | 0 | ||||||||||
Nicholas I. Fink | None | N/A | N/A | 0 | ||||||||||
Robert K. Biggart | None | N/A | N/A | 0 | ||||||||||
RETIREMENT AND POST-RETIREMENT BENEFITS 2017 PENSION BENEFITS | ||||||||||||||
| Name | Plan Name(1) | Number of Years Credited Service (#) | Present Value of Accumulated Benefit ($) (2)(3) | Payments During Last Fiscal Year | ||||||||||
Christopher J. Klein | Moen Incorporated Pension Plan | 13.75 | $ | 497,000 | 0 | |||||||||
| Fortune Brands Home & Security, Inc. Supplemental Retirement Plan | 13.75 | $ | 4,241,000 | 0 | ||||||||||
Patrick D. Hallinan | MasterBrand Cabinets, Inc. Pension Plan | 3.08 | $ | 63,000 | 0 | |||||||||
| MasterBrand Cabinets, Inc. Supplement Retirement Plan | 3.08 | $ | 19,000 | 0 | ||||||||||
| (1) | Mr. Klein accrued benefits under the Moen Incorporated Pension Plan, atax-qualified defined benefit pension plan (the “Moen Plan”) and the Fortune Brands Home & Security, Inc. Supplemental Retirement Plan, anon-qualified defined benefit supplemental pension plan (the “FBHS Supplemental Plan”) through December 31, |
| (2) | The benefit amounts listed reflect the present value of the accumulated benefit payable in the form of a single life annuity where payments continue for the life of the NEO but cease upon his death. All of thetax-qualified and supplementalnon-qualified pension plans provide for payment to be made in a single-life annuity to unmarried participants and in a qualified joint and survivor annuity for married participants. At the time of retirement, participants may elect, among other forms of payment, a reduced annuity in the joint and survivor form, which provides payments over the life of the participant and a named beneficiary. |
| (3) |
2017 EXECUTIVE COMPENSATION (CONTINUED)
FrozenTax-Qualified andNon-Qualified Pension BenefitsPensionBenefits.Mr. Klein was the only NEO accruing benefits under the Moen Plan in 2016.
Effective January 1, 2017,December 31, 2016, the Company froze all future benefit accruals to all participating employees, including Mr. Klein.
Mr. Klein, received pension benefit accruals through December 31, 2016 usingunder the following formula: 1.75% of final average earnings multiplied by years of benefit service as of December 31, 2007, plus 1% of final average earnings multiplied by years of benefit service onMoen Plan and after January 1, 2008. Payment of his benefit would be unreduced after attaining age 62, however, he could commence payment of his benefit as early as age 55. Early commencement would be calculated using a reduction of 6% per year prior to the attainment of age 62.
Messrs. Wyatt, Fink, Biggart and Randich are not eligible to participate in atax-qualified defined benefit pension plan because their hire or transfer dates, as applicable, occurred after the date the plans were frozen with respect to new participants.
Non-Qualified Pension Benefits.Fortune Brands maintains a supplemental retirement plan. The supplemental plan paysFBHS Supplemental Plan, which paid the difference between the benefits payable under the Moen Plan and the amount that would have been paid if the Code did not have a limitation on the amount of compensation permitted for inclusion of the calculation of benefits. The supplemental plan is an unfunded,non-qualified retirement plan, available to certain highly-compensated employees that participate in the Moen Plan. AsWhile Mr. Klein is the only NEO that accruedHallinan was employed by MasterBrand Cabinets from 2005 through 2008, he accumulated a pension benefitsbenefit under the MoenMBCI Plan through December 31, 2016, he is the only NEO that accruedand a supplemental pension benefitsbenefit under the supplemental plan. Effective January 1, 2017, the Company froze all future benefit accruals in the supplemental plan, including for Mr. Klein.MBCI Supplemental Plan. The present value of the accumulated benefits under the supplemental planthese plans will continue to fluctuate afterin the freeze datefuture based on changes in interestdiscount rates and actuarial assumptions.
Payment of Mr. Klein’stax-qualified pension benefit would be unreduced after attaining age 62. He could commence payment of his benefit as early as age 55 at a reduction rate of 6% per year prior to attainment of age 62. Under the supplemental plan,FBHS Supplemental Plan, payment of benefits commences at termination of employment following attainment of age 55, subject to any delay required under Section 409A of the Code. Additionally, early commencement of benefits would be calculated using a reduction of 6% per year prior to the attainment of age 62.65.
Messrs. Randich, Fink, Biggart and Wyatt were not eligible to participate in a2016 EXECUTIVE COMPENSATION (CONTINUED)tax-qualified defined benefit pension plan because their hire or transfer dates, as applicable, occurred after the date the plans were frozen with respect to new participants.
OtherTax Qualified and Non-Qualified Defined Contribution Benefits
Non-Qualified Contributions.Fortune Brands makesand GPG make profit sharing contributions to the Savings Plan on behalf of all eligible employees of the Company at its corporate headquarters. The Fortune Brands Supplemental Plan pays the difference between the profit sharing contribution payable under the Savings Plan and the amount that would have been payable if the Code did not have a limitation on the amount of compensation taken into account under the Savings Plan. Messrs. Klein, Wyatt, Fink and Biggart receivednon-qualified profit sharing contributions under the FBHS Supplemental Plan.employees. In 2016,2017, the eligible profit sharing contribution amount was equal to 6% of adjusted compensation, plus 7.5% for all eligible employees, includingamounts above the Social Security wage base limit, for Messrs. Klein, Hallinan, Biggart and Wyatt Fink and Biggart.5% for Mr. Fink. A portion of the amount of the profit sharing contribution, up to the limitation imposed by the Code, was made to the Savings Plan. The amount of the profit sharing contribution in excess of the limitation imposed by the Code was contributed to the FBHS Supplemental Plan on behalf of Messrs. Klein, Hallinan, Biggart and Wyatt and to the GPG Supplemental Plan on behalf of Mr. Fink. Mr. Randich does not receive profit sharing contributions under anynon-qualified defined contribution or profit sharing plan.
FBHS Supplemental PlanMr. Hallinan maintains an account holding prior supplementalnon-qualified profit sharing accounts are credited with interest monthly, usingcontributions under the Citigroup US Broad Investment-Grade (USBIG) Bond Index. The FBHSGPG Supplemental Plan pays any defined contribution amounts, in a lump sum following termination of employment, subject to any delay required under Section 409A of the Code.
Plan. Mr. Randich maintains an account holding prior supplemental qualifiednon-elective and supplemental profit sharing contributions under theTherma-Tru Corp. Supplemental Executive Retirement Plan (the“Therma-Tru SERP”), which is.
2017 EXECUTIVE COMPENSATION (CONTINUED)
FBHS Supplemental Plan and GPG Supplemental Plan profit sharing accounts are credited with interest monthly, using the Citigroup US Broad Investment-Grade (USBIG) Bond Index. The FBHS Supplemental Plan and the GPG Supplemental Plan pay any defined contribution amounts, in a lump sum following termination of employment, subject to any delay required under Section 409A of the Code. Participants in theTherma-Tru SERP have the option to invest in a number of mutual funds, which are valued on a monthlydaily basis. This account is invested in the Schwab 1000 Index Fund (SNXFX), which is a daily valued mutual fund. Any interest, dividends, gains or losses received from Schwab are allocated across the participants’ accounts in that fund. TheTherma-Tru SERP pays any qualifiednon-elective and supplement profit sharing contributions in a lump sum or in substantially equal annual installments following termination of employment, subject to any delay required under Section 409A of the Code.
| 2016 NONQUALIFIED DEFERRED COMPENSATION | ||||||||||||||||||||||||||||||||||||||||||
| 2017 NONQUALIFIED DEFERRED COMPENSATION | 2017 NONQUALIFIED DEFERRED COMPENSATION | |||||||||||||||||||||||||||||||||||||||||
| Name | Executive Contributions in Last FY ($) | Registrant Contributions in Last FY ($)(1) | Aggregate Earnings in Last FY ($)(2) | Aggregate Withdrawals/ Distributions ($) | Aggregate Balance at Last FYE ($) | Plan Name | Executive Contributions in Last FY ($) | Registrant Contributions in Last FY ($)(1) | Aggregate Earnings in Last FY ($)(2) | Aggregate Withdrawals/ Distributions ($) | Aggregate Balance at Last FYE ($) | |||||||||||||||||||||||||||||||
Christopher J. Klein | $0 | $166,568 | $31,803 | $0 | $1,309,553 | FBHS Supplemental | $0 | $186,595 | $52,133 | $0 | $1,528,254 | |||||||||||||||||||||||||||||||
E. Lee Wyatt, Jr. | $0 | $87,950 | $9,352 | $0 | $407,051 | |||||||||||||||||||||||||||||||||||||
David M. Randich(3) | $0 | $0 | $8,425 | $0 | $232,063 | |||||||||||||||||||||||||||||||||||||
Patrick D. Hallinan | FBHS Supplemental | $0 | td8,363 | $0 | $0 | $0 | ||||||||||||||||||||||||||||||||||||
GPG Supplemental | $0 | $0 | td,406 | $0 | $42,837 | |||||||||||||||||||||||||||||||||||||
David M. Randich | Therma-Tru Corp. Supplemental | $0 | $0 | $50,307 | $0 | $282,370 | ||||||||||||||||||||||||||||||||||||
Nicholas I. Fink | GPG Supplemental | $0 | $30,836 | $0 | $0 | $0 | ||||||||||||||||||||||||||||||||||||
| $0 | $42,912 | td3 | $0 | td,357 | FBHS Supplemental | $0 | $0 | td,348 | $0 | $45,617 | ||||||||||||||||||||||||||||||||
Robert K. Biggart | $0 | $38,541 | $697 | $0 | $45,768 | FBHS Supplemental | $0 | $43,993 | $2,813 | $0 | $87,122 | |||||||||||||||||||||||||||||||
E. Lee Wyatt, Jr. | FBHS Supplemental | $0 | $95,711 | $17,300 | $0 | $512,301 | ||||||||||||||||||||||||||||||||||||
| (1) | Amounts listed in this column were reported as compensation in the last fiscal year in the “All Other Compensation” column of the 2017 Summary Compensation Table. |
| (2) | No amounts listed in the Aggregate Earnings column were reported in the 2017 Summary Compensation Table. |
20162017 EXECUTIVE COMPENSATION(C (CONTINUED)
| POTENTIAL PAYMENTS UPON TERMINATION OR CHANGE IN CONTROL(1) | ||||||||||||||||||||||||||||||||
| Voluntary | Involuntary | Involuntary After | ||||||||||||||||||||||||||||||
For | Without Good Reason | For Cause | Without Cause | Death | Disability(2) | Retirement(3) | ||||||||||||||||||||||||||
Cash Severance |
| |||||||||||||||||||||||||||||||
Klein | 5,453,181 | 0 | 0 | 5,453,181 | 0 | 0 | 0 | 8,179,772 | ||||||||||||||||||||||||
Wyatt | 2,327,584 | 0 | 0 | 2,327,584 | 0 | 0 | 0 | 3,103,445 | ||||||||||||||||||||||||
Randich | 1,522,388 | 0 | 0 | 1,522,388 | 0 | 0 | 0 | 2,029,850 | ||||||||||||||||||||||||
Fink | 1,371,652 | 0 | 0 | 1,371,652 | 0 | 0 | 0 | 1,828,869 | ||||||||||||||||||||||||
Biggart | 1,276,074 | 0 | 0 | 1,276,074 | 0 | 0 | 0 | 1,701,432 | ||||||||||||||||||||||||
Health and Related Benefits(4) |
| |||||||||||||||||||||||||||||||
Klein | 34,797 | 0 | 0 | 34,797 | 2,060,000 | 0 | 0 | $ | 52,196 | |||||||||||||||||||||||
Wyatt | 21,584 | 0 | 0 | 21,584 | 2,325,000 | 0 | 0 | $ | 28,779 | |||||||||||||||||||||||
Randich | 15,182 | 0 | 0 | 15,182 | 590,000 | 0 | 0 | $ | 20,242 | |||||||||||||||||||||||
Fink | 26,098 | 0 | 0 | 26,098 | 1,530,000 | 0 | 0 | $ | 34,798 | |||||||||||||||||||||||
Biggart | 26,098 | 0 | 0 | 26,098 | 1,000,000 | 0 | 0 | $ | 34,798 | |||||||||||||||||||||||
Options(5) |
| |||||||||||||||||||||||||||||||
Klein | 0 | 0 | 0 | 0 | 1,233,734 | 808,646 | 0 | 1,233,734 | ||||||||||||||||||||||||
Wyatt | 0 | 0 | 0 | 0 | 488,478 | 326,802 | 326,802 | 488,478 | ||||||||||||||||||||||||
Randich | 0 | 0 | 0 | 0 | 358,867 | 252,595 | 252,595 | 358,867 | ||||||||||||||||||||||||
Fink | 0 | 0 | 0 | 0 | 245,624 | 156,200 | 0 | 245,624 | ||||||||||||||||||||||||
Biggart | 0 | 0 | 0 | 0 | 228,213 | 151,749 | 0 | 228,213 | ||||||||||||||||||||||||
RSUs |
| |||||||||||||||||||||||||||||||
Klein | 0 | 0 | 0 | 0 | 3,512,059 | 1,737,580 | 0 | 3,512,059 | ||||||||||||||||||||||||
Wyatt | 0 | 0 | 0 | 0 | 3,000,914 | 701,664 | 701,664 | 3,000,914 | ||||||||||||||||||||||||
Randich | 0 | 0 | 0 | 0 | 3,586,220 | 3,089,600 | 416,600 | 3,586,220 | ||||||||||||||||||||||||
Fink | 0 | 0 | 0 | 0 | 1,500,751 | 1,127,461 | 0 | 1,500,751 | ||||||||||||||||||||||||
Biggart | 0 | 0 | 0 | 0 | 642,628 | 323,438 | 0 | 642,628 | ||||||||||||||||||||||||
Performance Share Awards |
| |||||||||||||||||||||||||||||||
Klein | 0 | 0 | 0 | 0 | 2,947,848 | 1,173,368 | 0 | 2,947,848 | ||||||||||||||||||||||||
Wyatt | 0 | 0 | 0 | 0 | 1,146,326 | 470,076 | 470,076 | 1,146,326 | ||||||||||||||||||||||||
Randich | 0 | 0 | 0 | 0 | 724,208 | 280,588 | 280,588 | 724,208 | ||||||||||||||||||||||||
Fink | 0 | 0 | 0 | 0 | 635,658 | 262,368 | 0 | 635,658 | ||||||||||||||||||||||||
Biggart | 0 | 0 | 0 | 0 | 534,186 | 214,996 | 0 | 534,186 | ||||||||||||||||||||||||
Total Potential Payments Upon Termination or Change in Control |
| |||||||||||||||||||||||||||||||
Klein | 5,487,979 | 0 | 0 | 5,487,979 | 9,753,641 | 3,719,594 | 0 | 15,925,610 | ||||||||||||||||||||||||
Wyatt | 2,349,168 | 0 | 0 | 2,349,168 | 6,960,718 | 1,498,542 | 1,498,542 | 7,767,942 | ||||||||||||||||||||||||
Randich | 1,537,569 | 0 | 0 | 1,537,569 | 5,259,295 | 3,622,783 | 949,783 | 6,719,387 | ||||||||||||||||||||||||
Fink | 1,397,750 | 0 | 0 | 1,397,750 | 3,912,033 | 1,546,029 | 0 | 4,245,699 | ||||||||||||||||||||||||
Biggart | 1,302,172 | 0 | 0 | 1,302,172 | 2,405,027 | 690,183 | 0 | 3,141,257 | ||||||||||||||||||||||||
| POTENTIAL PAYMENTS UPON TERMINATION OR CHANGE IN CONTROL(1)(2) | ||||||||||||||||||||||||||||||||
| Voluntary | Involuntary | Death | Disability(3) | Retirement(4) | Involuntary After | |||||||||||||||||||||||||||
For | Without Good Reason | For Cause | Without Cause | |||||||||||||||||||||||||||||
Cash Severance |
| |||||||||||||||||||||||||||||||
Klein | 5,655,175 | 0 | 0 | 5,655,175 | 0 | 0 | 0 | 8,482,762 | ||||||||||||||||||||||||
Hallinan | 1,532,032 | 0 | 0 | 1,532,032 | 0 | 0 | 0 | 2,042,709 | ||||||||||||||||||||||||
Randich | 1,680,750 | 0 | 0 | 1,680,750 | 0 | 0 | 0 | 2,241,000 | ||||||||||||||||||||||||
Fink | 1,483,028 | 0 | 0 | 1,483,028 | 0 | 0 | 0 | 1,977,371 | ||||||||||||||||||||||||
Biggart | 1,424,227 | 0 | 0 | 1,424,227 | 0 | 0 | 0 | 1,898,969 | ||||||||||||||||||||||||
Health and Related Benefits(5) |
| |||||||||||||||||||||||||||||||
Klein | 48,660 | 0 | 0 | 48,660 | 2,060,000 | 0 | 0 | $ | 72,991 | |||||||||||||||||||||||
Hallinan | 37,568 | 0 | 0 | 37,568 | 1,650,000 | 0 | 0 | $ | 50,090 | |||||||||||||||||||||||
Randich | 17,534 | 0 | 0 | 17,534 | 615,000 | 0 | 0 | $ | 23,378 | |||||||||||||||||||||||
Fink | 26,421 | 0 | 0 | 26,421 | 535,000 | 0 | 0 | $ | 35,228 | |||||||||||||||||||||||
Biggart | 40,204 | 0 | 0 | 40,204 | 1,500,000 | 0 | 0 | $ | 53,605 | |||||||||||||||||||||||
Options(6) |
| |||||||||||||||||||||||||||||||
Klein | 0 | 0 | 0 | 0 | 3,896,566 | 2,502,146 | 0 | 3,896,566 | ||||||||||||||||||||||||
Hallinan | 0 | 0 | 0 | 0 | 368,712 | 162,209 | 0 | 368,712 | ||||||||||||||||||||||||
Randich | 0 | 0 | 0 | 0 | 950,995 | 615,062 | 615,062 | 950,995 | ||||||||||||||||||||||||
Fink | 0 | 0 | 0 | 0 | 842,028 | 563,148 | 0 | 842,028 | ||||||||||||||||||||||||
Biggart | 0 | 0 | 0 | 0 | 694,806 | 453,951 | 0 | 694,806 | ||||||||||||||||||||||||
RSUs |
| |||||||||||||||||||||||||||||||
Klein | 0 | 0 | 0 | 0 | 4,474,346 | 2,281,421 | 0 | 4,474,346 | ||||||||||||||||||||||||
Hallinan | 0 | 0 | 0 | 0 | 616,230 | 146,972 | 0 | 616,230 | ||||||||||||||||||||||||
Randich | 0 | 0 | 0 | 0 | 2,845,954 | 2,317,641 | 562,141 | 2,845,954 | ||||||||||||||||||||||||
Fink | 0 | 0 | 0 | 0 | 1,476,014 | 1,037,402 | 0 | 1,476,014 | ||||||||||||||||||||||||
Biggart | 0 | 0 | 0 | 0 | 791,711 | 412,922 | 0 | 791,711 | ||||||||||||||||||||||||
Performance Share Awards |
| |||||||||||||||||||||||||||||||
Klein | 0 | 0 | 0 | 0 | 4,482,365 | 2,289,440 | 0 | 4,482,365 | ||||||||||||||||||||||||
Hallinan | 0 | 0 | 0 | 0 | 615,838 | 146,580 | 0 | 615,838 | ||||||||||||||||||||||||
Randich | 0 | 0 | 0 | 0 | 1,100,673 | 572,360 | 572,360 | 1,100,673 | ||||||||||||||||||||||||
Fink | 0 | 0 | 0 | 0 | 920,233 | 481,620 | 0 | 920,233 | ||||||||||||||||||||||||
Biggart | 0 | 0 | 0 | 0 | 790,609 | 411,820 | 0 | 790,609 | ||||||||||||||||||||||||
Total Potential Payments |
| |||||||||||||||||||||||||||||||
Klein | 5,703,835 | 0 | 0 | 5,703,835 | 14,913,277 | 7,073,007 | 0 | 21,409,030 | ||||||||||||||||||||||||
Hallinan | 1,569,600 | 0 | 0 | 1,569,600 | 3,250,780 | 455,761 | 0 | 3,693,579 | ||||||||||||||||||||||||
Randich | 1,698,284 | 0 | 0 | 1,698,284 | 5,512,622 | 3,505,063 | 1,749,563 | 7,162,000 | ||||||||||||||||||||||||
Fink | 1,509,449 | 0 | 0 | 1,509,449 | 3,773,275 | 2,082,170 | 0 | 5,250,874 | ||||||||||||||||||||||||
Biggart | 1,464,431 | 0 | 0 | 1,464,431 | 3,777,126 | 1,278,693 | 0 | 4,229,700 | ||||||||||||||||||||||||
| (1) | This table assumes the specified termination events occurred on December 31, |
| (2) | Mr. Wyatt is excluded from this chart as he retired effective December 31, 2017. As a result of his retirement, the value of his equity awards that vested due to retirement treatment was $2,690,298, consisting of $970,196 for stock options, $864,603 for RSUs and $855,500 for PSAs (assuming target performance and based on the closing price of the Company’s common stock on December 29, 2017 ($68.44 per share)). |
| (3) | The amounts reported in this column assume that the executive remains on disability through the full vesting of the award. |
| The Health and Related Benefits listed under the “Death” column reflect the incremental value of life insurance benefits above the benefit level applicable to all employees generally. |
| The amount reported in the “Disability” column reflect the value of unvested stock options that would have continued to vest according to the vesting schedule. |
Termination of Employment and Change in Control Arrangements.To protect the Company’s interests in retaining its top talent, the Company has Severance Agreements with each NEO. Under the terms of the Severance Agreements, each NEO is entitled to severance benefits upon a qualifying termination of employment (i.e., termination by the Company without “cause” or by the NEO for “good reason”). The severance benefits under the Severance Agreements consist of:
an amount equal to a multiple (2 years for Mr. Klein and 1.5 years for all other NEOs) of the NEO’s (1) base salary, (2) target annual cash incentive, plus (3) any profit sharing allocation and matching contributions under the applicabletax-qualified andnon-qualified defined contributions plans for the year prior to the year in which the termination takes place;
an additional number of months (equal to the severance multiple described above) of coverage under health, life and accident plans to the extent allowed under the applicable plan; and
an amount equal to the annual cash incentive award the NEO would have received based upon actual Company (or applicable operating company) performance for the calendar year in which the termination date occurs, prorated for the NEO’s service during the year.
The Severance Agreements contain various restrictive covenants, including a one yearnon-solicitation provision, anon-disparagement provision, and a one yearnon-competition restriction. NEOs are also required to sign a release of legal claims against the Company to receive any severance payments.
All of the Severance Agreements contain provisions which provide for enhanced benefits in the event of a qualifying termination (i.e., termination by the Company without “cause” or by the NEO for “good reason”) following a change in control. The Severance Agreements contain “double triggers,” which means that there must be both a change in control of the Company (or applicable operating company) and a qualifying termination of employment before any enhanced benefits are paid. In the event Mr. Klein is terminated within 2 years following a change in control, his multiple is increased from 2 years to 3 years. In the event of termination within 2 years following a change in control of any of the other NEOs, the multiple is increased from 1.5 years to 2 years. The Severance Agreements do not allow for excise taxgross-ups on these amounts.
Treatment of Equity Awards Following a Termination of Employment (other than in the event of a Change in Control).If a NEO’s employment terminates with or without cause, all unvested PSAs, RSUs and stock options are forfeited. If a NEO dies, becomes disabled or retires, his or her outstanding equity awards vest or are paid as follows:
Treatment of Equity in the Event of Death, Disability or Retirement (for awards granted beginning in 2016) | ||||||
| Event | Performance Share Awards | Restricted Stock Units | Stock Options | |||
Death | Shares paid at the end of the performance period based on actual Company performance. | Outstanding RSUs fully vest. | Unvested stock options fully vest. | |||
Disability | Shares paid at the end of the performance period based on actual Company performance. | Outstanding RSUs continue to vest according to the vesting schedule. | Unvested stock options continue to vest according to the vesting schedule. | |||
Retirement | Shares paid at the end of the performance period based on actual Company performance. | Outstanding RSUs fully vest. | Unvested stock options fully vest. | |||
| (1) |
| The executive must have one year of service from the grant date prior to the date of disability to be entitled to receive the disability treatment listed above. |
| The executive must be 55 years of age with 5 years of service and also have one year of service from the grant date prior to the date of retirement to be entitled to receive the retirement treatment listed above. This provision is not applicable to the retention |
20162017 EXECUTIVE COMPENSATION(C (CONTINUED)
Treatment of Equity Awards Following a Change in Control and Termination of Employment.In the event a NEO is terminated by the Company without cause or by the NEO for good reason following a change in control, his or her equity awards vest or are paid as follows:
| Treatment of Equity In the Event of a Termination Following a Change In Control* | ||
| Award | Treatment | |
PSAs | Shares are paid assuming that target performance was achieved. | |
RSUs | All outstanding RSUs fully vest. | |
Stock Options | All unvested stock options fully vest. | |
| * | The Board has the ability to exercise its discretion to accelerate outstanding awards in the event of a change in control. |
| EQUITY COMPENSATION PLAN INFORMATION | ||||||||||||
| Plan Category | Number of upon exercise of (a)(1) | Weighted (b) | Number of securities remaining available for future issuance under equity compensation plans (excluding securities reflected in column (a)) (c)(2) | |||||||||
Equity compensation plans approved by security holders | 5,960,289 | $27.34 | 6,310,339 | |||||||||
Equity compensation plans not approved by security holders | 0 | n/a | 0 | |||||||||
Total | 5,960,289 | $27.34 | 6,310,339 | |||||||||
The SEC adopted a rule requiring annual disclosure of the ratio of the median employee’s annual total compensation to the total annual compensation of Mr. Klein, the Company’s chief executive officer. To understand this disclosure, we think it is important to give context to our operations. Our corporate headquarters are located in Deerfield, Illinois and we operate 45 manufacturing facilities and 44 distribution centers and warehouses worldwide. As a consumer products manufacturer, approximately 76% of our employees are involved in manufacturing our products. In addition, the majority of our manufacturing and assembly plant locations are located in rural areas while our corporate offices are generally located in urban areas. We strive to create a compensation program that is competitive in terms of both the position and the geographic location in which the employee is located. Accordingly, our pay structures vary amongst employees based on business unit, position and geographic location.
Identification of Median Employee
We selected October 1, 2017 as the date on which to determine our median employee. As of that date, the Company had approximately 23,622 employees (15,749 in the United States and 7,873 outside of the United States). For purposes of identifying the median employee, we used taxableyear-to-date compensation.To identify the median employee, the Company applied ade minimis exemption which allowed us to excludenon-U.S. employees in countries that make up five percent or less of our employee population. The Company excluded 4 employees in Guatemala, 5 in Taiwan, 4 in Hong Kong and 1,098 employees in China. After applying this exemption, the Company used a total of 22,511 employees (15,749in the United States and 6,762 outside of the United States) to identify the median employee. In addition, approximately 357 employees of Victoria & Albert were excluded from the calculation as the company was acquired in late 2017.
Using this methodology, we determined that our median employee was a full-time, hourly employee working for our plumbing group in an engineering support role. In determining the annual total compensation of the median employee, we calculated the employee’s compensation in accordance with Item 402(c)(2)(x) of RegulationS-K as required pursuant to SEC executive compensation disclosure rules, which included base and overtime pay, bonus, matching contributions to the Company’s 401(k), a profit sharing contribution and a change in the year-over-year actuarial value of the employee’s pension benefit. This calculation is the same calculation used to determine total compensation reported above in the 2017 Summary Compensation Table for the Chief Executive Officer.
2017 CEO Pay Ratio
| 2017 Total Compensation* | CEO Pay Ratio | |||||
Christopher J. Klein | $ | 9,372,432 | 136:1 | |||
Median Employee | $ | 68,684 | ||||
| * | Annual total compensation, as calculated in accordance with Item 402 of RegulationS-K. |
EQUITY COMPENSATION PLAN INFORMATION
| EQUITY COMPENSATION PLAN INFORMATION | ||||||||||||
| Plan Category | Number of upon exercise of (a)(1) | Weighted exercise price of outstanding (b) | Number of securities remaining available for future issuance under equity compensation plans (excluding securities reflected in column (a)) (c)(2) | |||||||||
Equity compensation plans approved by security holders | 5,267,679 | $36.28 | 5,510,649 | |||||||||
Equity compensation plans not approved by security holders | 0 | n/a | 0 | |||||||||
Total | 5,267,679 | $36.28 | 5,510,649 | |||||||||
| (1) | As of December 31, |
| (2) |
The Audit Committee is composed of five directors that are “independent” as defined under the New York Stock Exchange Listed Company Manual and Rule10A-3 of the Exchange Act. The Audit Committee has a written charter that has been approved by the Board. A copy of the Audit Committee Charter is available on the Company’s website athttp://ir.fbhs.com/committees.cfmcommittees.cfm. The Audit Committee has appointed PricewaterhouseCoopers LLP (“PwC”) as the Company’s independent registered public accounting firm for 2017.2018.
Management has the responsibility for the Company’s financial statements and overall financial reporting process, including the Company’s systems of internal controls. The independent registered public accounting firm has the responsibility to conduct an independent audit in accordance with generally accepted auditing standards and to issue an opinion on the accuracy of the Company’s financial statements and the effectiveness of the Company’s internal controls. The Audit Committee’s responsibility is to monitor and oversee these processes.
In this context, the Audit Committee has reviewed and discussed the audited financial statements and the Company’s quarterly and annual reports to the SEC with management and the independent registered public accounting firm. Management has confirmed to the Audit Committee that the Company’s financial statements were prepared in accordance with generally accepted accounting principles. The Audit Committee has met with the independent registered public accounting firm and discussed matters that are required to be discussed pursuant to the applicable requirements of the Public Company Accounting Oversight Board, including Auditing Standard No. 1301,Communications with Audit Committees.Board. The independent registered public accounting firm has provided an unqualified opinion regarding the Company’s financial statements for the year ended December 31, 2016.2017.
The Company’s independent registered public accounting firm has also provided the Audit Committee with the written disclosures and letter required by the Public Company Accounting Oversight Board regarding the independent registered public accounting firm’s communications with the Audit Committee concerning independence, and the Audit Committee has discussed with the independent registered public accounting firm that firm’s independence. The Audit Committee has also reviewednon-audit services provided by the independent registered public accounting firm and has considered the compatibility of these services with maintaining the auditor’s independence.
The Audit Committee annually reviews the independence and performance of the independent registered public accounting firm. Factors such as independence, industry knowledge, communication and fees are considered. A performance survey is completed by the Company at the end of each year to evaluate performance of the independent registered public accounting firm in multiple areas including quality of services, sufficiency of audit firm resources, communication and interaction as well as independence, objectivity and professional skepticism. Results are shared with the Audit Committee. Additionally the independent registered public accounting firm presents to the Audit Committee at the beginning of each year, a commitment letter outlining specific areas of focus for continued high quality client service. At the end of each year, the independent registered public accounting firm presents to the Audit Committee and the Company a self-assessment against those commitments which is reviewed and discussed during the Audit Committee meeting.
Based upon the review and discussions with management and the independent registered public accounting firm, the Audit Committee recommended to the Board that the audited financial statements be included in the Company’s Annual Report on Form10-K for the fiscal year ended December 31, 20162017 for filing with the SEC.
Audit Committee
Ronald V. Waters, III, Chair
A.D. David Mackay
John G. Morikis
David M. Thomas
Norman H. Wesley
AUDIT COMMITTEE MATTERS (CONTINUED)
Fees of Independent Registered Public Accounting Firm
PwC served as the Company’s independent registered public accounting firm during the year ended December 31, 2016.2017. All PwC services were approved in advance by the Audit Committee. The aggregate fees billed by PwC during 20162017 and 20152016 are set forth in the table below:
| Type of Fee | Year Ended December 31, 2016 | Year Ended December 31, 2015 | Year Ended December 31, 2017 | Year Ended December 31, 2016 | ||||||||||||
Audit Fees(1) | $ | 3,260,000 | $ | 3,196,000 | $ | 3,835,000 | $ | 3,260,000 | ||||||||
Audit-Related Fees | $ | 0 | $ | 135,000 | $ | 0 | $ | 0 | ||||||||
Tax Fees | $ | 1,247,000 | $ | 209,000 | $ | 827,000 | $ | 1,247,000 | ||||||||
All Other Fees | $ | 1,800 | $ | 2,000 | $ | 101,800 | $ | 1,800 | ||||||||
| (1) | For both |
| (2) | For |
| (3) | For |
Approval of Audit andNon-Audit Services
The Audit Committee has adopted policies and procedures for thepre-approval of all audit and permissiblenon-audit services provided by our independent registered public accounting firm. The Audit Committee annually reviews the audit andnon-audit services to be performed by the independent registered public accounting firm during the upcoming year. The Audit Committee considers, among other things, whether the provision of specificnon-audit services is permissible under existing law and whether it is consistent with maintaining the auditor’s independence. The Audit Committee then approves the audit services and any permissiblenon-audit services it deems appropriate for the upcoming year. The Audit Committee’spre-approval ofnon-audit services is specific as to the services to be provided and includespre-set spending limits. The provision of any additionalnon-audit services during the year, or the provision of services in excess ofpre-set spending limits, must bepre-approved by either the Audit Committee or by the Chairman of the Audit Committee, who has been delegated authority topre- approve such services on behalf of the Audit Committee. Anypre-approvals granted by the Chairman of the Audit Committee must be reported to the full Audit Committee at its next regularly scheduled meeting. All of the fees described above under audit fees, tax fees and all other fees for 20162017 werepre-approved by the Audit Committee pursuant to itspre-approval policies and procedures.
The Audit Committee has appointed PwC as our independent registered public accounting firm for the year ending December 31, 2017.2018. The Audit Committee and the Board recommend that you ratify this appointment. In line with this recommendation, the Board intends to introduce the following resolution at the Annual Meeting:
“RESOLVED, that the appointment of PricewaterhouseCoopers LLP as the independent registered public accounting firm for this Company for the year ending December 31, 20172018 is ratified.”
A representative of PwC will attend the Annual Meeting to make a statement if he or she desires and respond to appropriate questions that may be asked by stockholders. In the event the stockholders fail to ratify the appointment of PwC, the Audit Committee may appoint another independent registered public accounting firm or may decide to maintain its appointment of PwC.
The Board of Directors and the Audit Committee recommend that you vote FOR Proposal 2.
As required pursuant to Section 14A of the Exchange Act, the Company is providing stockholders with a vote to approve the compensation of the named executive officers as disclosed in this Proxy Statement, on an advisory,non-binding basis, which is commonly referred to as a“Say-on-Pay” vote. The Board has decided the advisory vote on executive compensation will be held on an annual basis at least until the nextnon-binding stockholder vote on the frequency thatof the advisory vote, should be held.which will occur at this Annual Meeting (see Proposal 4).
The Board believes that executive compensation should be closely tied to Company performance. Our executive compensation programs are designed to reward executives for the achievement of both short-term and long-term strategic and operational goals, as well as the creation of stockholder value. To accomplish this, the Compensation Committee has designed an executive compensation program that:
Creates and reinforces apay-for-performance culture;culture by tying compensation to Company performance;
Aligns management’s interests with those of the Company’s stockholders;
Attracts, retains and motivates superior talent through competitive compensation; and
Provides incentive compensation that promotes performance without encouraging excessive risk.risk-taking; and
Recognizes the cyclical nature of our business.
The Company asks that you indicate your approval of the compensation paid to our named executive officers in 2016,2017, as described in this Proxy Statement under the headings “Compensation Discussion and Analysis” and “Executive Compensation,” which includes the compensation tables and narratives.
Because your vote is advisory, it will not be binding on the Board. However, the Board and the Compensation Committee will review the results of the vote and consider the results when making future decisions regarding executive compensation.
For the reasons discussed above, the Board intends to introduce the following resolution at the Annual Meeting:
“RESOLVED, that the compensation of the named executive officers of the Company, as disclosed in this Proxy Statement under the headings “Compensation Discussion and Analysis” and “Executive Compensation,” including the compensation tables and their accompanying narrative discussion, is approved.”
The Board of Directors recommends that you vote FOR Proposal 3.
Pursuant to Section 14A of the Exchange Act, the Company is required to hold an advisory vote at least once every six years regarding the frequency with which the advisory vote to approve named executive officer compensation(“Say-on-Pay”) should be held. The Company last held such a vote at the 2012 Annual Meeting of Stockholders. After this year’s vote, it is expected that the nextsay-on-pay frequency vote will occur at the 2024 Annual Meeting of Stockholders.
The Board has determined that the Company should hold theSay-on-Pay vote every year, which is our current frequency. The Board believes that holding an annualSay-on-Pay vote is the best approach for the Company and enhances shareholder communication by providing shareholders with a clear, simple and timely way to express their views about the compensation decisions made in each year.
Stockholders will be able to specify one of four choices for this proposal on the proxy card: one year, two years, three years or abstain. While this voteis non-binding, the Board values the opinions of its shareholders and will consider the outcome of the vote when considering the frequency of future advisory shareowner votes on executive compensation.
The Board of Directors recommends that you vote “ONE YEAR” for the frequency on the advisory vote to approve compensation paid to the Company’s named executive officers.
We have listed below, as of March 3, 20172, 2018 (except as otherwise indicated), the beneficial ownership of the Company’s common stock by (a) each director, (including the nominees), (b) the named executive officers, (c) directors and executive officers of the Company as a group, and (d) each person known by us to be the beneficial owner of more than five percent of our outstanding common stock. The table is based on information we received from the directors and executive officers, the Trustee of our defined contribution plan and filings made with the SEC.
Name | Amount and Nature of Beneficial Ownership(1) | Percentage of Class | Amount and Nature of Beneficial Ownership(1) | Percentage of Class | ||||||||||||
The Vanguard Group(2) | 14,301,836 | 9.31 | % | 15,313,969 | 10.34 | % | ||||||||||
BlackRock, Inc.(3) | 13,174.182 | 8.58 | % | 12,725,571 | 8.59 | % | ||||||||||
Wellington Management Group LLP(4) | 7,758,906 | 5.05 | % | |||||||||||||
T. Rowe Price (4) | 10,904,344 | 7.36 | % | |||||||||||||
Robert K. Biggart | 64,576 | * | 93,692 | * | ||||||||||||
Nicholas I. Fink | 26,077 | * | 66,254 | * | ||||||||||||
Ann F. Hackett(5) | 27,672 | * | ||||||||||||||
Ann F. Hackett (5) | 29,804 | * | ||||||||||||||
Patrick D. Hallinan | 36,465 | * | ||||||||||||||
Susan S. Kilsby | 2,353 | * | 4,485 | * | ||||||||||||
Christopher J. Klein(6) | 1,283,002 | * | ||||||||||||||
Christoph J. Klein(6) | 1,130,364 | * | ||||||||||||||
A. D. David Mackay(7) | 22,485 | * | 24617 | * | ||||||||||||
John G. Morikis(8) | 28,742 | * | ||||||||||||||
John G. Morikis (8) | 31642 | * | ||||||||||||||
David M. Randich | 192,323 | * | 147536 | * | ||||||||||||
David M. Thomas(9) | 37,575 | * | 39,707 | * | ||||||||||||
Ronald V. Waters, III | 24,542 | * | 21,674 | * | ||||||||||||
Norman H. Wesley(10) | 77,451 | * | 52,654 | * | ||||||||||||
E. Lee Wyatt, Jr. (11) | 526,384 | * | ||||||||||||||
Directors and executive officers as a group (17 persons)(12) | 2,485,256 | 1.61 | % | |||||||||||||
E. Lee Wyatt(11) | 504,757 | * | ||||||||||||||
Directors and executive officers as a group (20 persons )(12) | 2,536,565 | 1.71 | % | |||||||||||||
| * | Less than 1% |
| (1) | Includes the following number of shares with respect to which the |
Name | Number of Shares | |||
Robert K. Biggart | ||||
Nicholas | ||||
| ||||
| ||||
Christopher J. Klein | ||||
| ||||
| ||||
David M. Randich | ||||
| ||||
| ||||
| ||||
E. Lee Wyatt, Jr. | ||||
| (2) | In a report filed by The Vanguard Group (“Vanguard”) on Schedule 13G/A filed on February |
| (3) | In a report filed by BlackRock, Inc. (“BlackRock”) on Schedule 13G/A filed on |
| (4) | In a report filed by |
CERTAIN INFORMATION REGARDING SECURITY HOLDINGS (CONTINUED)
| (5) | Includes |
| (6) | Includes |
CERTAIN INFORMATION REGARDING SECURITY HOLDINGS (CONTINUED)
| (7) | Includes 8,000 shares held by a trust for which Mr. Mackay has sole investment power; however, he disclaims beneficial ownership of such shares. |
| (8) | Includes 5,742 shares which Mr. Morikis has deferred until the January following the year in which he ceases to be a member of the Board pursuant to theNon-Employee Director Deferred Compensation Plan. |
| (9) | Includes 2,914 shares which Mr. Thomas has deferred until the January following the year in which he ceases to be a member of the Board pursuant to theNon-Employee Director Deferred Compensation Plan. Also includes |
| (10) | Includes |
| (11) | Includes |
| (12) | The table |
Section 16(a) Beneficial Ownership Reporting Compliance
Section 16(a) of the Exchange Act requires our directors, and certain officers as well as persons who haveand beneficial ownershipowners of more than 10ten percent of our outstanding common stock to file initial reports of beneficial ownership on Form 3, and reports of subsequent changes in beneficial ownership on Forms 4 or 5, with the SEC. Based solely on our review of these forms, and certifications from our directors and officers that no other reports were required for such persons,them, we believe that all directors, officers and officersbeneficial owners subject to Section 16 complied with the filing requirements applicable to them for the fiscal year ended December 31, 2016.2017.
March 7, 201714, 2018
RECONCILIATIONS
2017, 2016, 2015, 2014, 2013 2012 & 20112012 DILUTED EPS BEFORE CHARGES/GAINS RECONCILIATION(Unaudited)
Twelve Months Ended December 31, | Twelve Months Ended December 31, | Twelve Months Ended December 31, | ||||||||||||||||||||||||||||||
| 2016 | 2015 | % Change | 2014 | 2013 | 2012 | 2011 | % Change | |||||||||||||||||||||||||
|
|
|
|
|
|
|
|
|
|
|
|
|
|
|
| |||||||||||||||||
Earnings Per Common Share - Diluted | ||||||||||||||||||||||||||||||||
EPS Before Charges/Gains(f) | $ | 2.75 | $ | 2.07 | 33 | $ | 1.74 | $ | 1.37 | $ | 0.83 | $ | 0.57 | 382 | ||||||||||||||||||
Restructuring and other charges | (0.10 | ) | (0.10 | ) | — | (0.05 | ) | (0.02 | ) | (0.05 | ) | (0.05 | ) | (100 | ) | |||||||||||||||||
Asset impairment charges | — | — | — | (0.01 | ) | (0.12 | ) | (0.05 | ) | (0.09 | ) | 100 | ||||||||||||||||||||
Norcraft transaction costs | — | (0.08 | ) | 100 | — | — | — | — | — | |||||||||||||||||||||||
Income tax gains/(losses) | (0.02 | ) | — | — | 0.01 | — | 0.08 | — | — | |||||||||||||||||||||||
Defined benefit plan actuarial losses | (0.01 | ) | (0.01 | ) | — | (0.05 | ) | (0.02 | ) | (0.16 | ) | (0.31 | ) | 97 | ||||||||||||||||||
Write off of prepaid debt issuance costs | (0.01 | ) | — | — | — | — | — | — | — | |||||||||||||||||||||||
Adjusted pro forma tax rate adjustment | — | — | — | — | — | — | (0.07 | ) | 100 | |||||||||||||||||||||||
Capital structure change | — | — | — | — | — | — | (0.06 | ) | 100 | |||||||||||||||||||||||
Standalone corporate costs | — | — | — | — | — | — | 0.05 | (100 | ) | |||||||||||||||||||||||
Business separation costs | — | — | — | — | — | — | (0.01 | ) | 100 | |||||||||||||||||||||||
Diluted EPS - Continuing Operations | $ | 2.61 | $ | 1.88 | 39 | $ | 1.64 | $ | 1.21 | $ | 0.65 | $ | 0.03 | — | ||||||||||||||||||
| Twelve Months Ended December 31, | ||||||||||||||||||||||||||||||||||||
| 2017 | 2016 | % Change 2017 vs 2016 | 2015 | 2014 | % Change 2017 vs 2014 | 2013 | 2012 | % Change 2017 vs 2012 | ||||||||||||||||||||||||||||
|
|
|
|
|
|
|
|
|
|
|
|
|
|
|
|
|
| |||||||||||||||||||
Earnings Per Common Share - Diluted | ||||||||||||||||||||||||||||||||||||
EPS Before Charges/Gains(e) | $ | 3.08 | $ | 2.75 | 12 | $ | 2.07 | $ | 1.74 | 77 | $ | 1.37 | $ | 0.83 | 271 | |||||||||||||||||||||
Restructuring and other charges | (0.10 | ) | (0.10 | ) | — | (0.10 | ) | (0.05 | ) | (100 | ) | (0.02 | ) | (0.05 | ) | (100 | ) | |||||||||||||||||||
Asset impairment charges | (0.07 | ) | — | — | — | (0.01 | ) | (600 | ) | (0.12 | ) | (0.05 | ) | (40 | ) | |||||||||||||||||||||
Loss on sale of product line | (0.02 | ) | — | — | — | — | — | — | — | — | ||||||||||||||||||||||||||
Norcraft transaction costs(d) | — | — | — | (0.08 | ) | — | — | — | — | — | ||||||||||||||||||||||||||
Income Tax gains/(losses) | 0.16 | (0.02 | ) | 900 | — | 0.01 | — | — | 0.08 | 100 | ||||||||||||||||||||||||||
Defined benefit plan actuarial gains/(losses)(c) | — | (0.01 | ) | 100 | (0.01 | ) | (0.05 | ) | 100 | (0.02 | ) | (0.16 | ) | 100 | ||||||||||||||||||||||
Write off of prepaid debt issuance costs | — | (0.01 | ) | 100 | — | — | — | — | — | — | ||||||||||||||||||||||||||
Diluted EPS - Continuing Operations | $ | 3.05 | $ | 2.61 | 17 | $ | 1.88 | $ | 1.64 | 86 | $ | 1.21 | $ | 0.65 | 369 | |||||||||||||||||||||
For the twelve months ended December 31, 2017, diluted EPS before charges/gains is net income from continuing operations, net of tax including the impact from noncontrolling interests calculated on a dilutedper-share basis excluding $23.0 million ($16.3 million after tax or $0.10 per diluted share) of restructuring and other charges, asset impairments of $15.3 million ($11.1 million after tax or $0.07 per diluted share), the loss on sale of product line of $2.4 million ($2.5 million after tax or $0.02 per diluted share), the impact of income from actuarial gains associated with our defined benefit plans of $0.5 million ($0.3 million after tax) and an income tax gain arising from a net benefit related to the Tax Cuts and Jobs Act of 2017 of $25.7 million ($0.16 per diluted share).
For the twelve months ended December 31, 2016, diluted EPS before charges/gains is income from continuing operations, net of tax and including the impact from noncontrolling interests calculated on a dilutedper-share basis excluding $23.2 million ($16.5 million after tax or $0.10 per diluted share) of restructuring and other charges, the impact of the write off of prepaid debt issuance cost of $1.3 million ($0.8 million after tax or $0.01 per diluted share), expense related to an income tax itemsloss of $3.1 million ($0.02 per diluted share), and actuarial losses of $1.9 million ($1.3 million after tax or $0.01 per diluted share).
For the twelve months ended December 31, 2015, diluted EPS before charges/gains is income from continuing operations, net of tax and including the impact from noncontrolling interests calculated on a dilutedper-share basis excluding $22.7 million ($16.3 million after tax or $0.10 per diluted share) of restructuring and other charges, transaction costs related to the acquisition of Norcraft of $17.1 million ($13.4 million after tax or $0.08 per diluted share), the impact of expense from actuarial losses associated with our defined benefit plans of $2.5 million ($1.6 million after tax or $0.01 per diluted share) and a charge related to aan income tax itemloss of $0.2 million.
For the twelve months ended December 31, 2014, diluted EPS before charges/gains is income from continuing operations, net of tax and including the impact from noncontrolling interests calculated on a dilutedper-share basis excluding $13.5 million ($8.4 million after tax or $0.05 per diluted share) of restructuring and other charges, an income tax gain related to a tax benefit resulting from the write off of our investment in an international subsidiary of $1.6 million ($1.6 million after tax or $0.01 per diluted share), an asset impairment charge of $1.6 million ($1.0 million after tax or $0.01 per diluted share) and the impact of expense from actuarial losses associated with our defined benefit plans of $13.7 million ($8.7 million after tax or $0.05 per diluted share).
APPENDIX A (CONTINUED)
For the twelve months ended December 31, 2013, diluted EPS before charges/gains is income from continuing operations, net of tax and including the impact from noncontrolling interests calculated on a dilutedper-share basis excluding $3.7 million ($3.0 million after tax or $0.02 per diluted share) of restructuring and other charges, asset impairment charges of $27.4 million ($20.0 million after tax or $0.12 per diluted share) and the impact of expense from actuarial losses associated with our defined benefit plan of $5.1 million ($3.3 million after tax or $0.02 per diluted share).
For the twelve months ended December 31, 2012, diluted EPS before charges/gains is income from continuing operations, net of tax and including the impact from noncontrolling interests calculated on a dilutedper-share basis excluding $13.6 million ($8.9 million after tax or $0.05 per diluted share) of restructuring and other charges, asset impairment charges of $13.2 million ($8.1 million after tax or $0.05 per diluted share) pertaining to the impairment of certain indefinite lived trade names, income tax gains pertaining to the favorable resolution of tax audits of $12.7 million ($0.08 per diluted share) and the impact of expense from actuarial losses associated with our defined benefit plans of $42.2 million ($26.2 million after tax or $0.16 per diluted share).
For the twelve months ended December 31, 2011, diluted EPS before charges/gains is income from continuing operations, net of tax and including the impact from noncontrolling interests calculated on a dilutedper-share basis adjusted to reflect the actual number of diluted shares of the Company as of December 31, 2011 of 160.7 million, estimated incremental standalone corporate costs of $13.8 million ($8.6 million after tax or $0.05 per diluted share), an adjusted pro forma effective tax rate adjustment of $12.0 million ($0.07 per share) to reflect an effective tax rate of 35%, capital structure changes that reflect the borrowing arrangements and debt level of the Company as of October 4, 2011 of $14.4 million ($8.9 million after tax or $0.06 per diluted share), and excludes restructuring and other charges of $13.4 million ($8.4 million after tax or $0.05 per diluted share), business separation costs of $2.4 million ($1.7 million after tax or $0.01 per diluted share), asset impairment charges of $24.0 million ($14.6 million after tax or $0.09 per diluted share) pertaining to the impairment of certain indefinite lived trade names and the impact of expense from actuarial losses associated with our defined benefit plans of $80.0 million ($49.9 million after tax or $0.31 per diluted share).
(f)(d) (e) For definitions ofNon-GAAP measures, see Definitions of Terms page
Reconciliation of ROIC before charges/gains to ROIC (Unaudited)
(in millions)
| 2016 | 2015 | 2014 | ||||||||||||||||||||||||||||||||||||||||||||||||||||||
| Income from continuing operations, net of tax, less noncontrolling interests | Average Invested Capital | ROIC | Income from continuing operations, net of tax, less noncontrolling interests | Average Invested Capital | ROIC | Income from continuing operations, net of tax, less noncontrolling interests | Average Invested Capital | ROIC | ||||||||||||||||||||||||||||||||||||||||||||||||
Before charges/gains | $ | 468 | / | $ | 3,519 | = | 13.3 | % | $ | 359 | / | $ | 3,166 | = | 11.3 | % | $ | 296 | / | $ | 2,845 | = | 10.4 | % | ||||||||||||||||||||||||||||||||
Restructuring and other charges and other select items | (55 | ) | (54 | ) | (53 | ) | (101 | ) | (24 | ) | (90 | ) | ||||||||||||||||||||||||||||||||||||||||||||
As reported | $ | 412 | / | $ | 3,465 | = | 11.9 | % | $ | 306 | / | $ | 3,064 | = | 10.0 | % | $ | 272 | / | $ | 2,754 | = | 9.9 | % | ||||||||||||||||||||||||||||||||
| 2013 | 2012 | 2011 | ||||||||||||||||||||||||||||||||||||||||||||||||||||||
| Income from continuing operations, net of tax, less noncontrolling interests | Average Invested Capital | ROIC | Income from continuing operations, net of tax, less noncontrolling interests | Average Invested Capital | ROIC | Income from continuing operations, net of tax, less noncontrolling interests | Average Invested Capital | ROIC | ||||||||||||||||||||||||||||||||||||||||||||||||
Before charges/gains | $ | 239 | / | $ | 2,610 | = | 9.2 | % | $ | 143 | / | $ | 2,469 | = | 5.8 | % | $ | 108 | / | $ | 2,534 | = | 4.3 | % | ||||||||||||||||||||||||||||||||
Restructuring and other charges and other select items | (31 | ) | (34 | ) | (36 | ) | (70 | ) | (104 | ) | (55 | ) | ||||||||||||||||||||||||||||||||||||||||||||
As reported | $ | 208 | / | $ | 2,576 | = | 8.1 | % | $ | 107 | / | $ | 2,400 | = | 4.5 | % | $ | 5 | / | $ | 2,480 | = | 0.2 | % | ||||||||||||||||||||||||||||||||
(Unaudited)
| 2017 | 2016 | % Change 2017 vs 2016 | ||||||||||||||||||||||||||||||||||||||||||
| Income from continuing operations, net of tax, less noncontrolling interests | Average Invested Capital | ROIC | Income from continuing operations, net of tax, less noncontrolling interests | Average Invested Capital | ROIC | ROIC | ||||||||||||||||||||||||||||||||||||||
Before charges/gains | $ | 514 | / | $ | 3,713 | = | 13.9 | % | $ | 468 | / | $ | 3,519 | = | 13.3 | % | 4 | % | ||||||||||||||||||||||||||
Restructuring and other charges and other select items | (39 | ) | (48 | ) | (55 | ) | (54 | ) | ||||||||||||||||||||||||||||||||||||
As reported | $ | 475 | / | $ | 3,664 | = | 13.0 | % | $ | 412 | / | $ | 3,465 | = | 11.9 | % | 9 | % | ||||||||||||||||||||||||||
| 2015 | 2014 | % Change 2017 vs 2014 | ||||||||||||||||||||||||||||||||||||||||||
| Income from continuing operations, net of tax, less noncontrolling interests | Average Invested Capital | ROIC | Income from continuing operations, net of tax, less noncontrolling interests | Average Invested Capital | ROIC | ROIC | ||||||||||||||||||||||||||||||||||||||
Before charges/gains | $ | 359 | / | $ | 3,166 | = | 11.3 | % | $ | 296 | / | $ | 2,845 | = | 10.4 | % | 33 | % | ||||||||||||||||||||||||||
Restructuring and other charges and other select items | (53 | ) | (101 | ) | (24 | ) | (90 | ) | ||||||||||||||||||||||||||||||||||||
As reported | $ | 306 | / | $ | 3,064 | = | 10.0 | % | $ | 272 | / | $ | 2,754 | = | 9.9 | % | 31 | % | ||||||||||||||||||||||||||
| 2013 | 2012 | % Change 2017 vs 2012 | ||||||||||||||||||||||||||||||||||||||||||
| Income from continuing operations, net of tax, less noncontrolling interests | Average Invested Capital | ROIC | Income from continuing operations, net of tax, less noncontrolling interests | Average Invested Capital | ROIC | ROIC | ||||||||||||||||||||||||||||||||||||||
Before charges/gains | $ | 239 | / | $ | 2,610 | = | 9.2 | % | $ | 143 | / | $ | 2,469 | = | 5.8 | % | 139 | % | ||||||||||||||||||||||||||
Restructuring and other charges and other select items | (31 | ) | (34 | ) | (36 | ) | (70 | ) | ||||||||||||||||||||||||||||||||||||
As reported | $ | 208 | / | $ | 2,576 | = | 8.1 | % | $ | 107 | / | $ | 2,400 | = | 4.5 | % | 190 | % | ||||||||||||||||||||||||||
APPENDIX A (CONTINUED)
Return on Invested Capital - or ROIC - Before Charges/Gains is income from continuing operations, net of tax, less noncontrolling interests plusafter-tax interest expense derived in accordance with U.S. generally accepted accounting principles (“GAAP”)GAAP excluding any restructuring and other charges and other select items divided by a two point average of GAAP Invested Capital (net debt plus stockholders’ equity) excluding any restructuring and other charges and other select items. Restructuring charges are costs incurred to implement significant cost reduction initiatives and include workforce reduction costs. “Other charges” include charges or gains directly related to restructuring initiatives that cannot be reported as restructuring under GAAP. Such charges or gains may include inventory obsolescence provisions and trade receivables allowances from exiting product lines, accelerated depreciation resulting from the closure of facilities, and gains or losses on the sale of previously closed facilities. In addition at Corporate, other charges incurred represent external costs directly related to the acquisition of Norcraft, which primarily include expenditures from banking, legal, accounting and other similar services for the twelve months ended December 31, 2015. In addition, other charges include estimated acquisition related inventorystep-up expense in our Plumbing segment for the twelve months ended December 31, 2017, and December 31, 2016, and our Cabinets segment for the twelve months ended December 31, 2015, which are classified in cost of products sold. Other charges also included, in our Plumbing segment, compensation expense related to deferred purchase price consideration payable to certain former Victoria + Albert shareholders contingent on their employment through October 2018 and a transaction related U.K. stamp duty resulting from our acquisition of Victoria + Albert. Other select charges includesitems include asset impairment charges, income tax gains and losses, the impact of income and expense from actuarial gains or losses associated with our defined benefit plans and the write off of prepaid debt issuance costs. The twelve months ended December 31, 2011 have also been adjusted to reflect an adjusted pro forma effective tax rate of 35%, capital structure changes that reflect the borrowing arrangements and debt level of the Company as of October 4, 2011, estimated incremental standalone corporate expenses for the 2011 periods prior to the spin-off of the Company from Fortune Brands, Inc. (the “Separation”), and business separation costs. ROIC Before Charges/Gains is a measure not derived in accordance with GAAP. Management uses this measure to determine the returns generated by the Company and to evaluate and identify cost-reduction initiatives. Management believes this measure provides investors with helpful supplemental information regarding the underlying performance of the Company from year to year. These measures may be inconsistent with similar measures presented by other companies.
RECONCILIATION OF NET INCOME BEFORE CHARGES/GAINS TO GAAP NET INCOME
(In millions)
(Unaudited)
| Twelve Months Ended December 31, | ||||||||||||||||||||||||
| 2016 | 2015 | 2014 | 2013 | 2012 | 2011 | |||||||||||||||||||
|
|
|
|
|
|
|
|
|
|
|
| |||||||||||||
Net Income Before Charges/Gains | $ | 434 | $ | 338 | $ | 289 | $ | 234 | $ | 138 | $ | 92 | ||||||||||||
|
|
|
|
|
|
|
|
|
|
|
| |||||||||||||
Restructuring and other charges, net of tax | (16.5 | ) | (16.3 | ) | (8.4 | ) | (3.0 | ) | (8.9 | ) | (8.4 | ) | ||||||||||||
Asset Impairment charges, net of tax | — | — | (1.0 | ) | (20.0 | ) | (8.1 | ) | (14.6 | ) | ||||||||||||||
Norcraft transaction costs, net of tax | — | (13.4 | ) | — | — | — | — | |||||||||||||||||
Income tax gains/(losses) | (3.1 | ) | (0.2 | ) | 1.6 | — | 12.7 | — | ||||||||||||||||
Defined benefit plan actuarial losses, net of tax | (1.3 | ) | (1.6 | ) | (8.7 | ) | (3.3 | ) | (26.2 | ) | (49.9 | ) | ||||||||||||
Write off of prepaid debt issuance costs, net of tax | (0.8 | ) | — | — | — | — | — | |||||||||||||||||
Adjusted pro forma tax rate adjustment | — | — | — | — | — | (12.0 | ) | |||||||||||||||||
Capital Structure Adjustments, net of tax | — | — | — | — | — | (8.9 | ) | |||||||||||||||||
Standalone Corporate, net of tax | — | — | — | — | — | 8.6 | ||||||||||||||||||
Business Separation Costs, net of tax | — | — | — | — | — | (1.7 | ) | |||||||||||||||||
|
|
|
|
|
|
|
|
|
|
|
| |||||||||||||
Net Income, Continuing Operations, Reported | $ | 412 | $ | 306 | $ | 272 | $ | 208 | $ | 107 | $ | 5 | ||||||||||||
|
|
|
|
|
|
|
|
|
|
|
| |||||||||||||
Discontinued Operations | 1 | 9 | (114 | ) | 22 | 11 | (40 | ) | ||||||||||||||||
|
|
|
|
|
|
|
|
|
|
|
| |||||||||||||
Net Income | $ | 413 | $ | 315 | $ | 158 | $ | 230 | $ | 119 | $ | (36 | ) | |||||||||||
|
|
|
|
|
|
|
|
|
|
|
| |||||||||||||
Reconciliation of Operating Income before charges/gains to GAAP Operating Income (Unaudited) (in millions) |
| Twelve Months Ended December 31, | ||||||||||||||||||||||||||||||||||||
| 2017 | 2016 | % Change 2017 vs 2016 | 2015 | 2014 | % Change 2017 vs 2014 | 2013 | 2012 | % Change 2017 vs 2012 | ||||||||||||||||||||||||||||
|
|
|
|
|
|
|
|
|
|
|
|
|
|
|
|
|
| |||||||||||||||||||
Operating income before charges/gains(1) | $ | 725 | $ | 658 | 10 | $ | 538 | $ | 431 | 68 | $ | 353 | $ | 212 | 242 | |||||||||||||||||||||
Restructuring and other charges(a) | (23 | ) | (23 | ) | 1 | (40 | ) | (13 | ) | (72 | ) | (4 | ) | (14 | ) | (69 | ) | |||||||||||||||||||
Asset impairment charges(b) | (8 | ) | — | (100 | ) | — | — | (100 | ) | (21 | ) | (13 | ) | 37 | ||||||||||||||||||||||
Loss on sale of product line | (2 | ) | — | (100 | ) | — | — | (100 | ) | — | — | (100 | ) | |||||||||||||||||||||||
Defined benefit plan actuarial gains/(losses)(e) | 1 | (2 | ) | 126 | (3 | ) | (14 | ) | 104 | (5 | ) | (42 | ) | 101 | ||||||||||||||||||||||
|
|
|
|
|
|
|
|
|
|
|
|
|
|
|
|
|
| |||||||||||||||||||
GAAP operating income | $ | 692 | $ | 633 | 9 | $ | 496 | $ | 404 | 71 | $ | 323 | $ | 143 | 383 | |||||||||||||||||||||
|
|
|
|
|
|
|
|
|
|
|
|
|
|
|
|
|
| |||||||||||||||||||
Net incomeReconciliation of before charges/gains is income from continuing operations, net of tax, less noncontrolling interests and excludes restructuring and other charges, asset impairment charges, Norcraft transaction related expenses, income tax gains and losses, the impact of income and expense from actuarial gains or losses associated with our defined benefit plans and the write off of prepaid debt issuance costs. Net income before charges/gains for the twelve months ended December 31, 2011 have also been adjustedOperating Margin to reflect an adjusted pro forma effective tax rate of 35%, capital structure changes that reflect the borrowing arrangements and debt level of the Company as of October 4, 2011, estimated incremental standalone corporate expenses for the 2011 periods prior to the Separation, and business separation costs. Net income before charges/gains is a measure not derived in accordance with GAAP. Management uses this measure to evaluate the overall performance of the Company and believes this measure provides investors with helpful supplemental information regarding the underlying performance of the Company from period to period. This measure may be inconsistent with similar measures presented by other companies.Operating Margin
(Unaudited)
| Twelve Months Ended December 31, | ||||||||||||||||||||||||||||||||||||
| 2017 | 2016 | Change 2017 vs 2016 | 2015 | 2014 | Change 2017 vs 2014 | 2013 | 2012 | Change 2017 vs 2012 | ||||||||||||||||||||||||||||
Before charges/gains operating margin(2) | 13.7 | % | 13.2 | % | 0.5 pts | 11.8 | % | 10.7 | % | 3.0 pts | 9.5 | % | 6.8 | % | 6.9 pts | |||||||||||||||||||||
Restructuring and other charges(a) | (0.4 | %) | (0.5 | %) | (0.9 | %) | (0.3 | %) | (0.1 | %) | (0.4 | %) | ||||||||||||||||||||||||
Asset impairment charges(b) | (0.2 | %) | — | — | — | (0.6 | %) | (0.5 | %) | |||||||||||||||||||||||||||
Loss on sale of product line | — | — | — | — | — | — | ||||||||||||||||||||||||||||||
Defined benefit plan actuarial gains/(losses)(c) | — | — | (0.1 | %) | (0.3 | %) | (0.1 | %) | (1.3 | %) | ||||||||||||||||||||||||||
|
|
|
|
|
|
|
|
|
|
|
|
|
|
|
|
|
| |||||||||||||||||||
Operating margin | 13.1 | % | 12.7 | % | 0.4 pts | 10.8 | % | 10.1 | % | 3.0 pts | 8.7 | % | 4.6 | % | 8.5 pts | |||||||||||||||||||||
|
|
|
|
|
|
|
|
|
|
|
|
|
|
|
|
|
| |||||||||||||||||||
APPENDIX A (CONTINUED)
RECONCILIATION OF OPERATING INCOME BEFORE CHARGES/GAINS TO GAAP OPERATING INCOME
(In millions)
(Unaudited)
| For the twelve months ended December 31, | For the twelve months ended December 31, | For the twelve months ended December 31, | ||||||||||||||||||||||||||||||
| 2016 | 2015 | % Change | 2014 | 2013 | 2012 | 2011 | % 2011 | |||||||||||||||||||||||||
|
|
|
|
|
|
|
|
|
|
|
|
|
|
|
| |||||||||||||||||
FORTUNE BRANDS HOME & SECURITY | ||||||||||||||||||||||||||||||||
Operating income before charges/gains | $ | 657.8 | $ | 538.4 | 22 | $ | 430.7 | $ | 353.0 | $ | 212.2 | $ | 160.8 | 309 | ||||||||||||||||||
Restructuring charges(a) | (13.9 | ) | (16.6 | ) | 16 | (7.0 | ) | (2.8 | ) | (4.7 | ) | (3.6 | ) | (286 | ) | |||||||||||||||||
Other charges(a) | ||||||||||||||||||||||||||||||||
Cost of products sold | (8.3 | ) | (7.5 | ) | (11 | ) | (5.9 | ) | (0.7 | ) | (8.9 | ) | (9.8 | ) | 15 | |||||||||||||||||
Selling, general and administrative expenses | (1.0 | ) | (15.7 | ) | 94 | (0.6 | ) | (0.2 | ) | — | — | (100 | ) | |||||||||||||||||||
Asset impairment charges | — | — | — | — | (21.2 | ) | (13.2 | ) | (24.0 | ) | 100 | |||||||||||||||||||||
Standalone corporate costs(b) | — | — | — | — | — | — | 13.8 | (100 | ) | |||||||||||||||||||||||
Business separation costs(c) | — | — | — | — | — | — | (2.4 | ) | 100 | |||||||||||||||||||||||
Defined benefit plan actuarial losses(d) | (1.9 | ) | (2.5 | ) | 24 | (13.7 | ) | (5.1 | ) | (42.2 | ) | (80.0 | ) | 98 | ||||||||||||||||||
|
|
|
|
|
|
|
|
|
|
|
|
|
|
|
| |||||||||||||||||
Operating income (GAAP) | $ | 632.7 | $ | 496.1 | 28 | $ | 403.5 | $ | 323.0 | $ | 143.2 | $ | 54.8 | 1,055 | ||||||||||||||||||
|
|
|
|
|
|
|
|
|
|
|
|
|
|
|
| |||||||||||||||||
(1) Operating income before charges/gains is operating income derived in accordance with GAAP including estimated incremental stand alone corporate expenses for 2011 periods prior to the Separation andU.S. generally accepted accounting principles (“GAAP”) excluding restructuring and other charges, asset impairment charges, business separation costsloss on the sale of a product line and the impact of income and expense from actuarial gains or losses associated with our defined benefit plans. Operating income before charges/gains is a measure not derived in accordance with GAAP. Management uses this measure to evaluate the returns generated by FBHS and its business segments. Management believes this measure provides investors with helpful supplemental information regarding the underlying performance of the Company from period to period. This measure may be inconsistent with similar measures presented by other companies.
(a) (b) (c) (d) For definitions of Non-GAAP measures, see Definitions of Terms
APPENDIX A (CONTINUED)
RECONCILIATION OF BEFORE CHARGES/GAINS OPERATING MARGIN TO OPERATING MARGIN
(In millions)
(Unaudited)
| For the twelve months ended December 31, | ||||||||||||||||||||||||||||
| 2016 | 2015 | Change | 2014 | 2013 | 2012 | 2011 | ||||||||||||||||||||||
|
|
|
|
|
|
|
|
|
|
|
|
|
| |||||||||||||||
FORTUNE BRANDS HOME & SECURITY | ||||||||||||||||||||||||||||
Before Charges/Gains Operating Margin | 13.2 | % | 11.8 | % | 140 bps | 10.7 | % | 9.5 | % | 6.8 | % | 5.6 | % | |||||||||||||||
Restructuring & Other Charges | (0.5 | %) | (0.5 | %) | (0.3 | %) | (0.1 | %) | (0.4 | %) | (0.5 | %) | ||||||||||||||||
Norcraft transaction costs(e) | — | (0.4 | %) | — | — | — | — | |||||||||||||||||||||
Asset impairment charges | — | — | — | (0.6 | %) | (0.5 | %) | (0.8 | %) | |||||||||||||||||||
Standalone corporate costs | — | — | — | — | — | 0.5 | % | |||||||||||||||||||||
Business separation costs | — | — | — | — | — | (0.1 | %) | |||||||||||||||||||||
Defined benefit plan actuarial losses | — | (0.1 | %) | (0.3 | %) | (0.1 | %) | (1.3 | %) | (2.8 | %) | |||||||||||||||||
Operating Margin | 12.7 | % | 10.8 | % | 190 bps | 10.1 | % | 8.7 | % | 4.6 | % | 1.9 | % | |||||||||||||||
(2) Operating margin is calculated as operating income derived in accordance with GAAP divided by GAAP Net Sales. Before charges/gains Operatingoperating margin is operating income derived in accordance with GAAP excluding restructuring and other charges, asset impairment charges, loss on the sale of a product line and for FBHS, Norcraft transaction costs, standalone corporate costs, business separation costs and the impact of income and expense from actuarial gains or losses associated with our defined benefit plans recorded in the Corporate segment and dividing by GAAP netsnet sales. Before charges/gains operating margin is a measure not derived in accordance with GAAP. Management uses this measure to evaluate the returns generated by FBHS and its business segments. Management believes this measure provides investors with helpful supplemental information regarding the underlying performance of the Company from period to period. This measure may be inconsistent with similar measures presented by other companies.
(e)(a) (b) (c) For definitions ofNon-GAAP measures, see Definitions of Terms page
RECONCILIATION OF NET INCOME BEFORE CHARGES/GAINS TO GAAP NET INCOME
(In millions)
(Unaudited)
| Twelve Months Ended December 31, | ||||||||||||||||||||||||||||||||||||
| 2017 | 2016 | % Change 2017 vs 2016 | 2015 | 2014 | % Change 2017 vs 2014 | 2013 | 2012 | % Change 2017 vs 2012 | ||||||||||||||||||||||||||||
|
|
|
|
|
|
|
|
|
|
|
|
|
|
|
|
|
| |||||||||||||||||||
Net Income Before Charges/Gains | $ | 479 | $ | 434 | 10 | $ | 338 | $ | 289 | 66 | $ | 234 | $ | 138 | 248 | |||||||||||||||||||||
|
|
|
|
|
|
|
|
|
|
|
|
|
|
|
|
|
| |||||||||||||||||||
Restructuring and other Charges, net of tax | (16 | ) | (17 | ) | 1 | (16 | ) | (8 | ) | (94 | ) | (3 | ) | (9 | ) | (83 | ) | |||||||||||||||||||
Asset Impairment charges, net of tax | (11 | ) | — | — | — | (1 | ) | — | (20 | ) | (8 | ) | (37 | ) | ||||||||||||||||||||||
Loss on Sale of product line | (3 | ) | — | — | — | — | — | — | — | — | ||||||||||||||||||||||||||
Income tax gains/(losses) | 26 | (3 | ) | 929 | — | 2 | — | — | 13 | 102 | ||||||||||||||||||||||||||
Defined benefit plan actuarial gains/(losses), net of tax | — | (1 | ) | 100 | (2 | ) | (9 | ) | 100 | (3 | ) | (26 | ) | 100 | ||||||||||||||||||||||
Write-off of prepaid debt issuance costs, net of tax | — | (1 | ) | 100 | — | — | — | — | — | — | ||||||||||||||||||||||||||
Norcraft transaction costs, net of tax | — | — | — | (13 | ) | — | — | — | — | — | ||||||||||||||||||||||||||
|
|
|
|
|
|
|
|
|
|
|
|
|
|
|
|
|
| |||||||||||||||||||
Net Income, Continuing Operations, Reported | $ | 475 | $ | 412 | 15 | $ | 306 | $ | 272 | 74 | $ | 208 | $ | 107 | 343 | |||||||||||||||||||||
|
|
|
|
|
|
|
|
|
|
|
|
|
|
|
|
|
| |||||||||||||||||||
Discontinued Operations | (2 | ) | 1 | (400 | ) | 9 | (114 | ) | 98 | 22 | 11 | (121 | ) | |||||||||||||||||||||||
|
|
|
|
|
|
|
|
|
|
|
|
|
|
|
|
|
| |||||||||||||||||||
Net Income | $ | 473 | $ | 413 | 14 | $ | 315 | $ | 158 | 199 | $ | 230 | $ | 119 | 298 | |||||||||||||||||||||
|
|
|
|
|
|
|
|
|
|
|
|
|
|
|
|
|
| |||||||||||||||||||
Net income before charges/gains is income from continuing operations, net of tax, less noncontrolling interests and excludes restructuring and other charges, asset impairment charges, the loss on the sale of product line, income tax gains/(losses), the impact of income and expense from actuarial gains or losses associated with our defined benefit plans, the write off of prepaid debt issuance costs and Norcraft transaction related expenses. Net income before charges/gains is a measure not derived in accordance with GAAP. Management uses this measure to evaluate the overall performance of the Company and believes this measure provides investors with helpful supplemental information regarding the underlying performance of the Company from period to period. This measure may be inconsistent with similar measures presented by other companies.
APPENDIX A (CONTINUED)
Definitions of Terms:Non-GAAP Measures
(a) Restructuring charges are costs incurred to implement significant cost reduction initiatives and include workforce reduction costs. Other charges“Other charges” represent charges or gains directly related to restructuring initiatives that cannot be reported as restructuring under GAAP. Such charges or gainscosts may include losses on disposal of inventories,inventory obsolescence provisions and trade receivables allowances from exiting product lines, accelerated depreciation resulting from the closure of facilities, and gains andor losses on the sale of previously closed facilities. At Corporate, other charges incurred represent external costs directly related to the acquisition of Norcraft and primarily include expenditures from banking, legal, accounting and other similar services for the twelve months ended December 31, 2015. In addition, other charges includesinclude estimated acquisition related inventorystep-up expense in our Plumbing segmentof $2.0 million for the twelve months ended December 31, 2017, and $3.8 million for the twelve months ended December 31, 2016 in our Plumbing segment and $2.1 million for the twelve months ended December 31,2015 in our Cabinets segment; these charges are classified in cost of products sold. Other charges also included in our Plumbing segment include $1.6 million of compensation expense related to deferred purchase price consideration payable to certain former Victoria + Albert shareholders contingent on their employment through October 2018 and $0.7 million of transaction related U.K. stamp duty resulting from our acquisition of Victoria + Albert.
(b) Asset impairment charges for the twelve months ended December 31, 2015,2017, represent an impairment of a cost investment in the costa developmental stage home security company classified in other expense and an impairment of products sold category.
(b) The Company estimates that it would have incurred approximately $14 million of incremental corporatea long-lived Corporate asset classified in selling, general and administrative expenses if it had functioned as an independent standalone public company for the twelve months ended December 31, 2011.
(c) Business separation costs are costsand include impairments related tonon-cashnon-recurring costs associated with our decision during the modificationfirst quarter of share-based compensation awards as2017 to sell a result of the Separation.security product line.
(d)(c) Represents actuarial gains or losses associated with our defined benefit plans. Actuarial gains or losses in a period represent the difference between actual and actuarially assumed experience, principally related to liability discount rates and plan asset returns, as well as other actuarial assumptions including compensation rates, turnover rates, and health care cost trend rates. The Company recognizes actuarial gains or losses immediately in operating income to the extent they cumulatively exceed a “corridor.” The corridor is equal to the greater of 10% of the fair value of plan assets or 10% of a plan’s projected benefit obligation. Actuarial gains or losses are determined at required remeasurement dates which occur at least annually in the fourth quarter. Remeasurements due to plan amendments and settlements may also occur in interim periods during the year. Our operating income before charges/gains reflects our expected rate of return on pension plan assets which in a given period may materially differ from our actual return on plan assets. Our liability discount rates and plan asset returns are based upon difficult to predict fluctuations in global bond and equity markets that are not directly related to the Company’s business. We believe that the exclusion of actuarial gains or losses from operating income before charges/gains provides investors with useful supplemental information regarding the underlying performance of the business from period to period that may be considered in conjunction with our operating income as measured on a GAAP basis. We present this supplemental information because such actuarial gains or losses may create volatility in our operating income that does not necessarily have an immediate corresponding impact on operating cash flow or the actual compensation and benefits provided to our employees. The table below sets forth additional supplemental information on the Company’s historical actual and expected rate of return on plan assets, as well as discount rates used to value its defined benefit obligations:
($ In millions) | Year Ended December 31, 2016 | Year Ended December 31, 2015 | Year Ended December 31, 2014 | Year Ended December 31, 2013 | Year Ended December 31, 2012 | Year Ended December 31, 2011 | Year Ended December 31, 2017 | Year Ended December 31, 2016 | Year Ended December 31, 2015 | Year Ended December 31, 2014 | Year Ended December 31, 2013 | Year Ended December 31, 2012 | ||||||||||||||||||||||||||||||||||||||||||||||||||||||||||||||||||||||||||||||||||||
| % | $ | % | $ | % | $ | % | $ | % | $ | % | $ | % | $ | % | $ | % | $ | % | $ | % | $ | % | $ | |||||||||||||||||||||||||||||||||||||||||||||||||||||||||||||||||||||||||
Actual return on plan assets | 10.0 | % | $ | 46.6 | (2.1 | )% | ($ | 18.2 | ) | 9.8 | % | $ | 52.0 | 15.2 | % | $ | 74.6 | 14.5 | % | $ | 63.7 | (0.6 | )% | ($2.7 | ) | 16.3 | % | $ | 83.2 | 10.0 | % | $ | 46.6 | (2.1 | )% | ($ | 18.2 | ) | 9.8 | % | $ | 52.0 | 15.2 | % | $ | 74.6 | 14.5 | % | $63.7 | |||||||||||||||||||||||||||||||||||||||||||||||
Expected return on plan assets | 6.6 | % | 37.2 | 6.8 | % | 40.2 | 7.4 | % | 42.2 | 7.8 | % | 41.8 | 7.8 | % | 36.8 | 8.5 | % | 41.3 | 6.4 | % | 37.3 | 6.6 | % | 37.2 | 6.8 | % | 40.2 | 7.4 | % | 42.2 | 7.8 | % | 41.8 | 7.8 | % | 36.8 | ||||||||||||||||||||||||||||||||||||||||||||||||||||||||||||
Discount rate at December 31: | ||||||||||||||||||||||||||||||||||||||||||||||||||||||||||||||||||||||||||||||||||||||||||||||||
Pension benefits | 4.3 | % | 4.6 | % | 4.2 | % | 5.0 | % | 4.2 | % | 4.9 | % | 3.8 | % | 4.3 | % | 4.6 | % | 4.2 | % | 5.0 | % | 4.2 | % | ||||||||||||||||||||||||||||||||||||||||||||||||||||||||||||||||||||||||
Postretirement benefits | 3.4 | % | 4.1 | % | 3.5 | % | 4.3 | % | 3.7 | % | 4.6 | % | 3.4 | % | 3.4 | % | 4.1 | % | 3.5 | % | 4.3 | % | 3.7 | % | ||||||||||||||||||||||||||||||||||||||||||||||||||||||||||||||||||||||||
APPENDIX A (CONTINUED)
(e)(d) Represents external costs directly related to the acquisition of Norcraft and primarily includes expenditures for banking, legal, accounting and other similar services. In addition, it includes the impact of expense related to our estimated purchase accounting inventorystep-up.
(f)(e) Diluted EPS before charges/gains is income from continuing operations, net of tax, less noncontrolling interests calculated on a dilutedper-share basis excluding restructuring and other charges, asset impairment charges, Norcraft transaction related expenses, income tax items,gains and losses, the impact of income and expense from actuarial gains or losses associated with our defined benefit plans, the loss on the sale of product line and the write offwrite-off of prepaid debt issuance costs. Diluted EPS before charges/gains for the twelve months ended December 31, 2011 have also been adjusted to reflect an adjusted pro forma effective tax rate of 35%, capital structure changes that reflect the borrowing arrangements and debt level of the Company as of October 4, 2011, the 1:1 share distribution resulting from thespin-off of the Company from Fortune Brands, Inc. (the “Separation”), estimated incremental standalone corporate expenses for the 2011 periods prior to the Separation, and business separation costs. Diluted EPS before charges/gains is a measure not derived in accordance with GAAP. Management uses this measure to evaluate the overall performance of the Company and believes this measure provides investors with helpful supplemental information regarding the underlying performance of the Company from period to period. This measure may be inconsistent with similar measures presented by other companies.
Use ofNon-GAAP Financial Information in Connection with Incentive Compensation
The Company utilizes measures not derived in accordance with GAAP such as operating margin before charges/gains, operating income before charges/gains, earnings per share before charges/gains, and return on invested capital before charges/gains, when determining performance results in connection with the incentive compensation programs as described in the Compensation Discussion and Analysis (“CD&A”). The 20162017 EPS results as set forth in the CD&A were calculated on a before charges/gains basis. For purposes of calculating the performance share award payout percentage for the period 20142015 to 2016,2017, the benefit of the early adoption of ASU2016-09 “Improvements to Employee Share-Based Payments” was included. For purposes of calculating the Annual Incentive payout percentage, the benefit from the early adoption of ASU2016-09 “Improvements to Employee Share Based Payments” was excluded, and was further adjusted for the impact of actual foreign exchange rates versus plan foreign exchange rates. The 20162017 ROIC results as set forth in the CD&A were calculated on a before charges/gains basis and represents income from continuing operations, net of tax, lessnon-controlling interests plusafter-tax interest expense, and excludes any restructuring and other charges and other select items, divided by a two point average of GAAP Invested Capital (net debt plus stockholders’ equity), excluding any restructuring and other charges and other select items. For purposes of calculating the performance share award payout percentage for the period 20142015 to 2016,2017, the benefit of the early adoption of ASU2016-09 “Improvements to Employee Share-BasedShareBased Payments” was included. For purposes of calculating the Annual Incentive payout percentage, the benefit from the early adoption of ASU2016-09 “Improvements to Employee Share Based Payments” was excluded and was further adjusted for the impact of actual foreign exchange rates versus plan foreign exchange rates. The 20162017 Operating Income and Operating Margin results as set forth in the CD&A were calculated on a before charges/gains basis and was also adjusted for the impact of actual foreign exchange rates versus plan foreign exchange rates and other select items. These figures may be different from those used by management when providing guidance or discussing Company results. These measures should not be considered in isolation or as a substitute for any measure derived in accordance with GAAP and may also be inconsistent with similar measures presented by other companies.


FORTUNE BRANDS HOME & SECURITY, INC.
ATTN: CORPORATE SECRETARY
520 LAKE COOK ROAD
DEERFIELD, IL 60015-5611
VOTE BY INTERNET - www.proxyvote.com
Use the Internet to transmit your voting instructions and for electronic delivery of information up until 11:59 P.M. Eastern Time the day before the cut-off date or meeting date. Have your proxy card in hand when you access the website and follow the instructions to obtain your records and to create an electronic voting instruction form.
VOTE BY PHONE - 1-800-690-6903
Use any touch-tone telephone to transmit your voting instructions up until 11:59 P.M. Eastern Time the day before the cut-off date or meeting date. Have your proxy card in hand when you call and then follow the instructions.
VOTE BY MAIL
Mark, sign and date your proxy card and return it in the postage-paid envelope we have provided or return it to Vote Processing, c/o Broadridge, 51 Mercedes Way, Edgewood, NY 11717.
ELECTRONIC DELIVERY OF FUTURE STOCKHOLDER COMMUNICATIONS
If you would like to reduce the costs incurred by our company in mailing proxy materials, you can consent to receiving all future proxy statements, proxy cards and annual reports electronically via e-mail or the Internet. To sign up for electronic delivery, please follow the instructions above to vote using the Internet and, when prompted, indicate that you agree to receive or access stockholder communications electronically in future years.
TO VOTE, MARK BLOCKS BELOW IN BLUE OR BLACK INK AS FOLLOWS:
| KEEP THIS PORTION FOR YOUR RECORDS | ||||||
DETACH AND RETURN THIS PORTION ONLY THIS PROXY CARD IS VALID ONLY WHEN SIGNED AND DATED. | ||||||
| FORTUNE BRANDS HOME & SECURITY, INC. | ||||||||||||||||||||
The Board of Directors recommends you voteFOR the following proposals: | ||||||||||||||||||||
Proposal 1 - Election of Class | For | Against | Abstain | |||||||||||||||||
1a. | ☐ | ☐ | ☐ | |||||||||||||||||
1b. | ☐ | ☐ | ☐ | |||||||||||||||||
1c. | ☐ | ☐ | ☐ | |||||||||||||||||
| For | Against | Abstain | ||||||||||||||||||
Proposal 2 - Ratification of the appointment of PricewaterhouseCoopers LLP as independent registered public accounting firm for | ☐ | ☐ | ☐ | |||||||||||||||||
Proposal 3 - Advisory vote to approve named executive officer compensation. | ☐ | ☐ | ☐ | |||||||||||||||||
The Board of Directors recommends you vote1 YEAR on the following proposal: | 1 Year | 2 Years | 3 Years | Abstain | ||||||||||||||||
Proposal 4 - To approve, by non-binding advisory vote, the frequency of the advisory vote on named executive officer compensation. | ☐ | ☐ | ☐ | ☐ | ||||||||||||||||
NOTE:Such other business as may properly come before the meeting or any adjournment thereof. | ||||||||||||||||||||
For address changes and/or comments, please check this box and write them on the back where indicated. | ☐ | |||||||||||||||||||
Note: Please sign as your name appears on the Proxy. If shares are held by joint tenants, both should sign. When signing as attorney, executor, administrator, trustee or guardian, please give your full title as such. If a corporation, please sign in full corporate name by authorized officer. If a partnership, please sign in full partnership name by authorized person. | ||||||||||||||||||||
Please Sign, Date and Return the Proxy Promptly Using the Enclosed Envelope.
| Signature [PLEASE SIGN WITHIN BOX] | Date | Signature (Joint Owners) | Date |
V.1.1
ANNUAL MEETING OF STOCKHOLDERS
Tuesday, May 2, 20171, 2018
Renaissance Chicago North Shore Hotel
933 Skokie Boulevard
Northbrook, Illinois 60062
Receive Future Proxy Materials Electronically
Help Fortune Brands Home & Security make a difference by eliminating paper proxy mailings to your home or business. With your consent, we can stop sending paper copies of Proxy Statements, Annual Reports and related materials to you and you can conveniently view them on-line. To participate, go tohttp://enroll.icsdelivery.com/fbhs and follow the prompts.
Reminder
You may vote by telephone or over the Internet. Voting electronically is quick, easy and also saves the company money. Just follow the instructions on your Proxy Card.proxy card.
If you vote the shares on the Internet or by phone, you do not need to mail back the Proxy Card.proxy card. YOUR VOTE IS IMPORTANT. THANK YOU FOR VOTING.
Important Notice Regarding Internet Availability of Proxy Materials for the Annual Meeting:
The Fortune Brands Home & Security, Inc. Proxy Statement and Annual Report on Form 10-K are available onwww.proxyvote.com.
E18731-P86332-Z69350E36210-P02449-Z71773
| |
The Board of Directors solicits this proxy for use at the Annual Meeting on Tuesday, May 2, 2017.1, 2018.
The stockholder(s) whose signature(s) appear(s) on the reverse side of this proxy card appoint(s) each of CHRISTOPHER J. KLEIN, ROBERT K. BIGGARTand E. LEE WYATT, JR.BIGGART and PATRICK D. HALLINAN (and any other person chosen by Messrs. Klein, Biggart or Wyatt)Hallinan) proxies, to vote all shares of Fortune Brands Home & SecuritycommonSecurity common stock which the stockholder(s) would be entitled to vote on at the Annual Meeting of Stockholders to be held on May 2, 20171, 2018 at theRenaissancethe Renaissance Chicago North Shore Hotel, 933 Skokie Boulevard, Northbrook, Illinois at 8:00 a.m. CDT, on Proposals 1, 2, 3 and 34 referred to on the reverse side anddescribedand described in the Proxy Statement, and on any other matters which may properly come before the meeting, with all powers the stockholder(s) wouldpossesswould possess if personally present and at any adjournment or postponement of the Annual Meeting. A majority of the proxies (or, if only one, then that one) or their substitutes acting at the meeting may exercise all powers conferred.
This proxy when properly executed will be voted in the manner directed by the stockholder(s). Unless the stockholder(s) indicate(s) otherwise, the proxies will voteFOR the election of the nominees to the Board of Directors (Proposal 1), andFOR Proposals 2 and 3.3 and1 YEAR for the frequency of holding a vote on executive compensation (Proposal 4).
If you participate in the Fortune Brands Home & Security Stock Fund under a retirement savings trust, your signature on the reverse side will be a direction to the trustee to vote as instructed.
FORTUNE BRANDS HOME & SECURITY, INC.
520 LAKE COOK ROAD
DEERFIELD, IL 60015-5611
| Address Changes/Comments: |
| |||||||||
| ||||||||||
(If you noted any Address Changes/Comments above, please mark corresponding box on the reverse side.)
Continued and to be signed on reverse side
V.1.1